Whether it’s the capital on offer, the equity investors demand, or simply their willingness to invest, every aspect of startup funding is tied together by one seemingly inscrutable concept: valuation.
The perceived value of your startup is the linchpin of every investment negotiation you’ll ever have, and understanding exactly how investors value your startup is the first step in securing great investment terms.
With that in mind, we’re exploring the most common methods of startup valuation, and looking at how they impact your equity, ownership and investment options.
EARLY STAGE VS LATE STAGE VALUATION METHODS
Many of these valuation methods are extremely subjective, and even those that rely on bona fide accounting principles still have a subjective element built-in, for one very simple reason: value is subjective. Even with an inscrutable data-set, a startup’s value is determined by the amount somebody is willing to pay for it.
It’s for that reason that startup valuation methods are often blended together, edited and altered to reach a particular conclusion. This is never more evident than in the case of early-stage startup valuations.
Large, established startups have the benefit of tangible revenue, and valuations can be driven by their past performance. But investors often invest before companies make profit, or even generate revenue. In these instances, the startup valuation methods used are incredibly subjective, relying on heuristic stand-ins for revenue.
As you’re about to see, there’s no such thing as a truly objective valuation. So if you find yourself on the wrong end of a low valuation, dust yourself off, work out how the investor reached their conclusion, and try again.
1) THE COMPARABLES METHOD
The comparable method of startup valuation is probably the simplest: find a comparable company to the one you’re trying to value, and use its valuation as a stand-in for the new startup.
In the same way that two houses might have their size, layout and outside space compared, two startups might have their MAU, churn rates and MRR growth compared to create a stand-in valuation:
“Startup X is worth $4 million, and Startup Y is comparable to Startup X, so the same valuation applies”.
There are obvious problems with this methodology — few startups are likely to be similar enough to warrant this approach as a sole method of valuation — but for many investors, this offers a starting point for assessing the value of early (pre-revenue) stage startups.
2) THE CONFORMITY METHOD
Startup accelerators like Y Combinator are incredibly oversubscribed, and that affords them the freedom to set their own valuation methodology: a one-size-fits-all approach that massively simplifies investment.
This usually takes the form of a fixed investment in exchange for a fixed equity share. To be accepted into the program, the investor’s terms need to be accepted — and if a founder doesn’t like the deal they’re offered, there are a few hundred other founders queuing behind them to take their place.
Y Combinator has done a lot to ensure the fairness of their particular deal, and their approach completely removes the problem of valuing early-stage startups. Each startup is offered the same amount, for the same share, giving all Y Combinator companies a pre-money valuation of just over $1.7 million.

3) THE SCORECARD METHOD
The scorecard method is a variation on the comparison method detailed above. It’s commonly used by angel investors to compare a new investment opportunity to an “average” startup in a given region and industry,
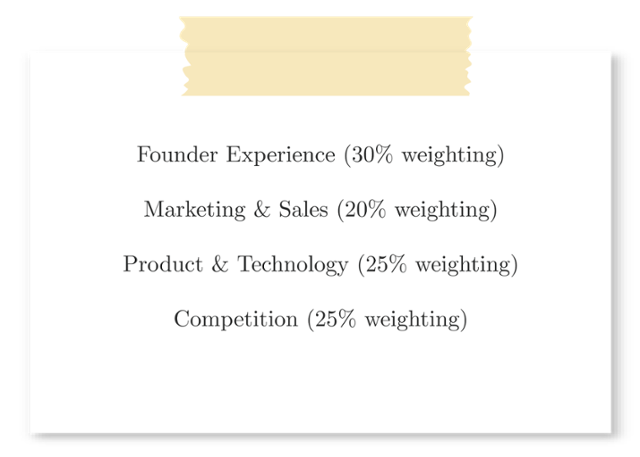
Let’s assume that a typical early-stage B2B SaaS startup, in London, is valued at $1.5 million. An angel would create a list of desirable characteristics, outlining the factors they believes impact startup success (things like founder experience, sales & marketing expertise, and industry competition).
These factors are then subjectively weighted according to their perceived impact on success:

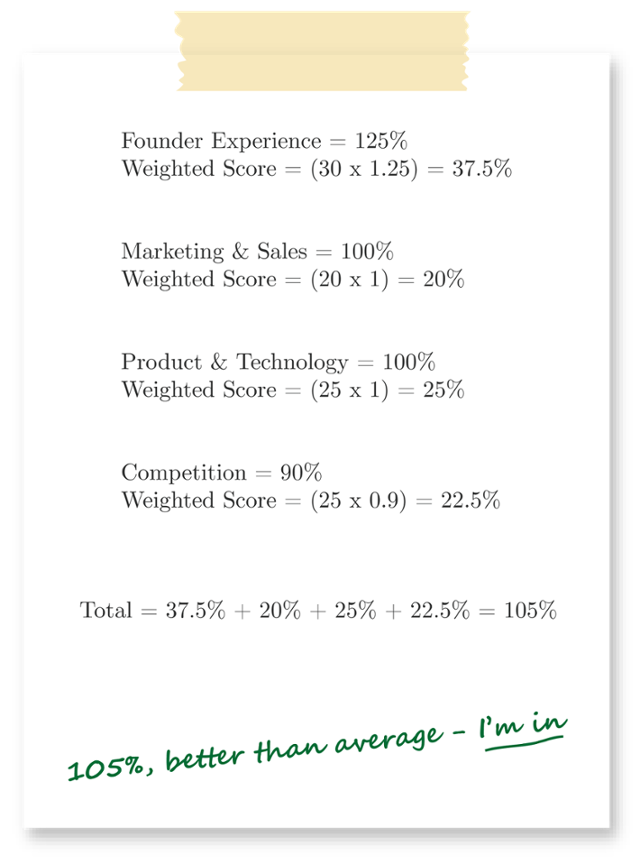
The investment opportunity is then scored across each of these categories, with its score determined by its superiority or inferiority compared to an “average” startup.
If a particular criterion is determined to be average, it scores 100%; better than average and it’ll score over 100%; worse than average, less than 100%. These scores are then added together for a final scorecard valuation.

Returning to our average valuation of $1.5 million, we can see that this particular investor believes the new startup to be more valuable than the average (by 5%), and worth $1.575 million (1.5 * 1.05) as a result.
4) THE VENTURE CAPITAL METHOD
Whenever investment is offered in exchange for equity, the investor needs an exit to recoup their money (and hopefully profit).
Both angels and VCs will have a particular return they need their portfolio companies to generate, and the Venture Capital method allows investors to work backwards from their intended return, and calculate the value and equity requirements of a particular deal.
Imagine an investor that’s looking to invest in your startup, with the intention of an exit in three years.
Three years from now, you’re forecasting that your company’s post-tax earnings will be $2 million. In order to work out how much your company could feasibly be sold for (its terminal valuation), we need to multiply those post-tax earnings by the company’s revenue multiple (we’ll explore this later). For this example, we’re using a multiple of 15:
Most investors have an expected return (their Internal Rate of Return, or IRR) they need their portfolio companies to generate: in this instance, let’s assume the startup needs to grow by 30%, year-on-year.
Assuming an initial investment of $150,000, the investor needs an exit value (the amount their shares will be worth upon sale) of roughly $330,000:
We can then work out the percentage of the company the investor would need to own to generate that return when the company is finally sold (at its terminal value of $30 million):
To sell their equity for the required amount, the investor needs to own almost 11% of the company.
However, subsequent rounds of investment will serve to dilute their ownership, so to finish on 11%, they’ll need their starting share to be higher. With an expected dilution of 25% (a common figure for VC investments), we can work out what their starting equity stake would need to be: in this instance, closer to 15%.
Lastly, we can use these figures to work out the company’s current valuation. Assuming the investment of $150,000 is worth 14.6% of the company, the startup’s post-money valuation is just over a million dollars…
…and its pre-money valuation is about $870,000:
5) DISCOUNTED CASH FLOW
The Discounted Cashflow Method values a startup by predicting its future cashflow, and then discounting it to reflect:
- A. the time value of money (typically the risk-free interest the investment could yield over the same time period)
- B. the risk of that cashflow failing to materialise.
In order to predict future cashflow with any degree of certainty, it’s necessary to have a stable history of revenue: something which most startups lack. As a result, this type of valuation (and many of the other late-stage valuation methods that follow) is used in conjunction with other methodologies as a starting point for valuation.

6) REVENUE MULTIPLES
Revenue multiples are another form of comparative valuation, using data from public companies to draw comparisons to earlier-stage startups.
Investors begin valuation by looking at public companies similar (in terms of industry vertical, revenue growth rate, etc.) to their target startup. As these comparison companies are publicly traded, it’s possible to find out two important pieces of information:
- The company’s Enterprise Value, an approximation of the cost of buying it.
- The company’s earnings.
It’s relatively simple to work out a target startup’s earnings, but it’s much harder to calculate its potential sales value. Instead, we can look to comparable businesses to find the relationship between their earnings and their valuation, and extrapolate that relationship to our own startup.
Their are several ways of doing this, each with their own pros and cons:
- Price to Earnings Ratio
- Price to Sales Ratio
- Enterprise Value to EBITDA Ratio
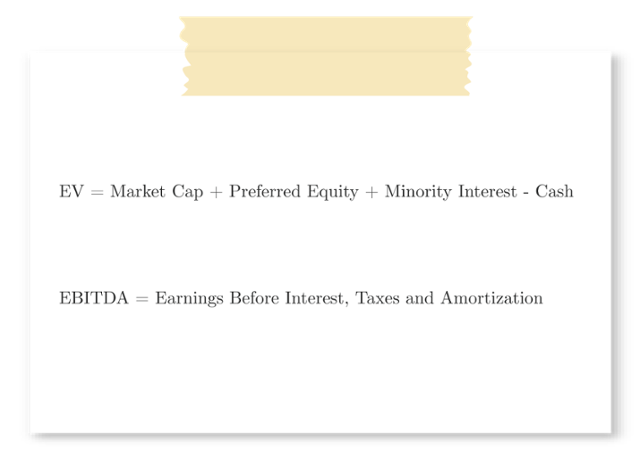
We’ll stick to one of the most common methods: Enterprise Value (EV) to EBITDA.

For example, let’s assume a public company has an Enterprise Value of $220 million, and an EBITDA of $44 million:
Applying the formula, the company has an EV/EBITDA ratio of 5:
In simple terms, this means the company is valued at 5x its earnings. By calculating this ratio across a broad range of similar companies, we can calculate the median revenue multiple for businesses of this type, and use that to value our own startup:
Changes to the median revenue multiple for startup companies reflect changing market trends and levels of investor confidence.
From a relatively stable market of 5x revenue between 2004 and 2011, the valuation of SaaS startups exploded to an all-time high of between 12x and 20x revenue in 2013. Since then, multiples have settled back down, but despite talk of a “bubble”, SaaS startups are still worth significantly more than they were a decade ago.

