Introduction
In the current competitive business environment, achieving sustainability is a key goal for businesses of all sizes. To make informed decisions and foster growth, understanding both product performance and customer behavior is essential. This is where AARRR and product come into play. In this article, we will delve into the of AARRR and explore various product metrics that can success for your business.
Who coined the term AARRR Framework and why?
Dave McClure, a Silicon Valley investor and founder of 500 Startups, developed the AARRR framework. McClure saw that many startup companies were easily distracted by superficial metrics, such as likes on social media.
With AARRR, McClure had a twofold goal
- Initially, guide emerging companies in honing their focus exclusively on metrics directly impacting their business’s well-being.
- Guide companies in utilizing the right data to evaluate and enhance both product management and marketing efforts.
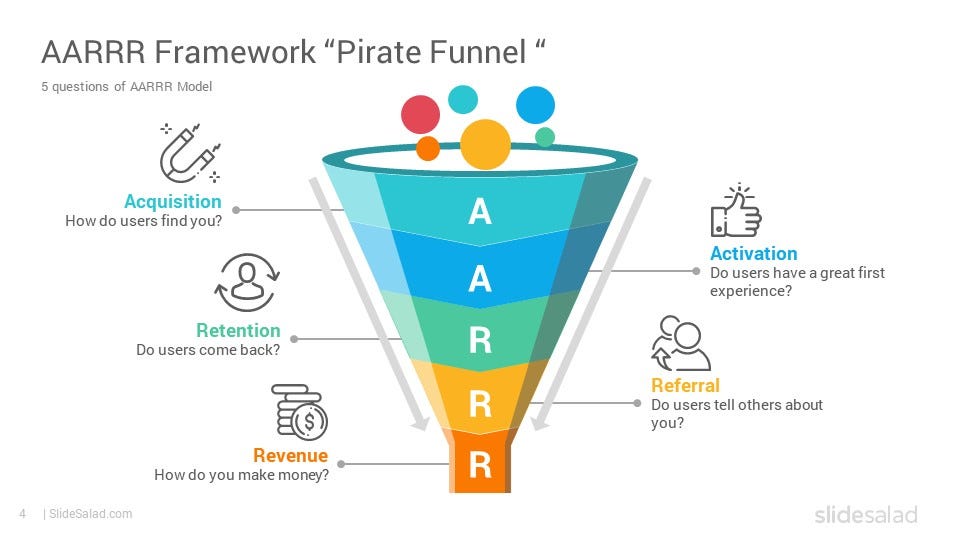
AARRR stands for AARRR stands for acquisition, activation, retention, referral and revenue, which make up the stages of the customer life cycle.
“The path to success is paved with data-driven decision making.” — Anonymous

In today’s digital era, grasping your product’s performance and user behavior is vital for growth. Businesses turn to impactful product metrics, with AARRR — Acquisition, Activation, Retention, Revenue, and Referral — providing a streamlined framework. This system helps pinpoint areas for enhancement, allowing organizations to optimize strategies effectively.
In short, AARRR Framework used for product conversions & growth
In this article, we will delve into each component of the AARRR framework, explore product metrics, and discuss how they can be harnessed to unlock growth for your business.

A- Acquisition: Building the Foundation
Goal: Build trust and hook them up
Focus: On attracting potential customers to your product or service. To successfully track and measure acquisition, certain metrics come into play:
- Conversion Rate: Track and boost your acquisition by closely monitoring and experimenting with your conversion rate, which measures the percentage of visitors completing desired actions like sign-ups or purchases.
- Cost Per Acquisition (CPA): CPA, or customer acquisition cost, measures the average expense of gaining a customer. By assessing your marketing spend to new customers. A reduced CPA can greatly enhance long-term profitability.
- To calculate CPA: Total Marketing Spend / Number of New Customers Acquired
- Traffic Source Performance: Analyze traffic sources to pinpoint high-quality leads and conversions. Web analytics tools, measuring metrics like click-through rates and bounce rates, offer insights to optimize acquisition strategies.
Is every product created from network effects?
No, it is inherent to certain products only. For example, let’s consider Survey Monkey. The more users visit and utilize the platform, the better the survey and data points become, enhancing the experience for subsequent users. This exemplifies an indirect network effect, collecting diverse user perspectives and generating valuable data.
Creating more surveys leads to new AI models, benefiting the experience for both existing and new audiences.

A- Activation: Nurturing Your Users
Once you have successfully acquired users, the next step is ensuring their activation. Activation refers to turning new users into active and engaged customers.
- Visiting additional pages
- Experimenting with additional features
- Spending a given amount of time on your site or app
- Signing up for your newsletter
- Signing up for your free trial
This is also defined as an “Aha Moment”
😲Aha moment: The crucial instant when new users first grasp the value of your product — a sudden moment of discovery.
Here are some essential metrics to consider:
- Activation Rate: The activation rate, measured by the percentage of users completing onboarding, gauges the effectiveness of onboarding and activation strategies.
- Time-to-Value (TTV): TTV, or Time to Value, represents how swiftly users find value in your product. Reducing TTV enhances user experience and increases engagement and loyalty.
- User Engagement: Monitor session duration, user sessions, and repeat visits to gauge engagement. Regular tracking helps identify areas for improvement and tailor your product to meet user needs better.

🐧Activity:
- Discover the “aha moments” in the apps you use daily.
- Inspire, explore, and design your favorite “aha moment”, aiming to engage and captivate users with it.
R- Retention: Keeping Your Users Engaged
“Retention is the bedrock of sustainable growth.”
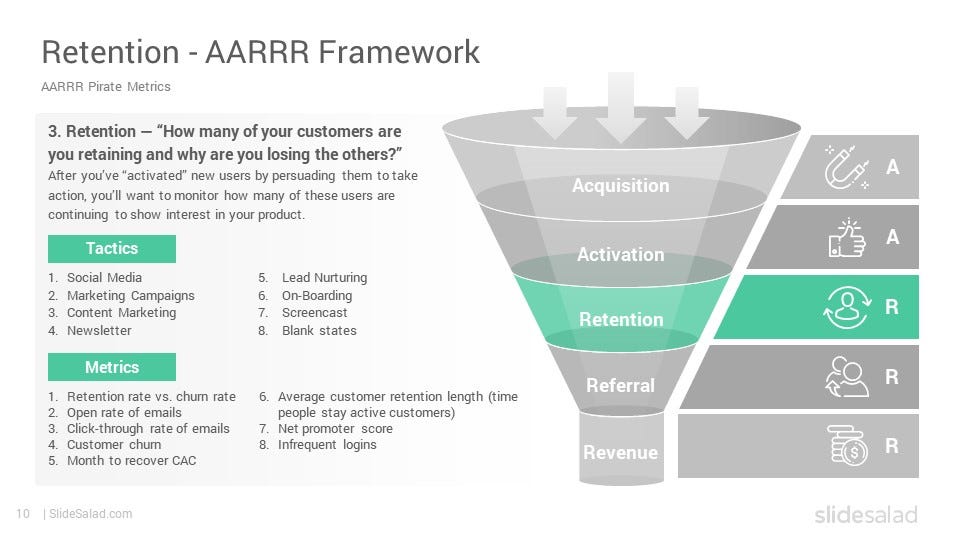
Retaining customers is crucial for long-term business success. It is more cost-effective to retain existing customers than constantly acquire new ones. Here are some metrics to focus on for optimum retention:
- Churn Rate: Churn rate measures the percentage of customers who discontinue using your product. High churn signals issues, but by pinpointing reasons and applying targeted retention strategies, you can reduce churn and foster customer loyalty.
- Customer Lifetime Value (CLTV): CLTV estimates the total revenue a customer is expected to generate. Calculating CLTV helps determine the value of customer retention and reveals up-selling and cross-selling opportunities.
- Cohort Analysis: Cohort analysis groups customers by acquisition time, tracking behavior over time to identify retention patterns. This insight allows a focus on improving customer satisfaction and loyalty.
The key idea here is to compare user engagement scenarios.
For instance, if 100 users were onboarded on day 1 and only 25 returned on day 7, versus another scenario where 100 users onboarded on day 1 and 70 returned on day 7.
In the first case, there was lower retention, as only 25 out of the initial 100 users returned on day 7.
Our goal is to enhance the number of new users who join today and return tomorrow.

R- Referral: Harnessing the Power of Advocacy
Referrals can be a game-changer for your business. Happy and satisfied customers can become your brand ambassadors and bring in new customers.
Here are some metrics to measure the impact of your referral strategies:
- Net Promoter Score (NPS): NPS gauges customer loyalty and satisfaction by asking about the likelihood of recommending your product or service. A high NPS signals strong advocacy, paving the way for organic growth through referrals.
- Referral Conversion Rate: Referral conversion rate gauges the percentage of referrals converting into new customers. Grasping this metric allows you to refine referral programs and enhance conversion rates.
- Virality Coefficient: The virality coefficient quantifies how many new users each existing user refers. A coefficient above 1 signals exponential growth potential. Enhancing this coefficient maximizes the organic reach of your product.
“ Referrals are the ultimate compliment and testament to the value of your product.”
A successful referral product is built on the “aha moment”, where incentives align with the core product experience, making it easy and compelling for users to refer.
- Emails with referral promotions embedded
- Referral contests
- Other marketing campaigns designed to make it easy to share the product with others
Example: Dropbox implemented a strategy offering up to 16 GB of free space by encouraging users to invite their friends to join the platform.

R- Revenue: Maximizing Profitability
“Revenue is the fuel that powers your business forward.”
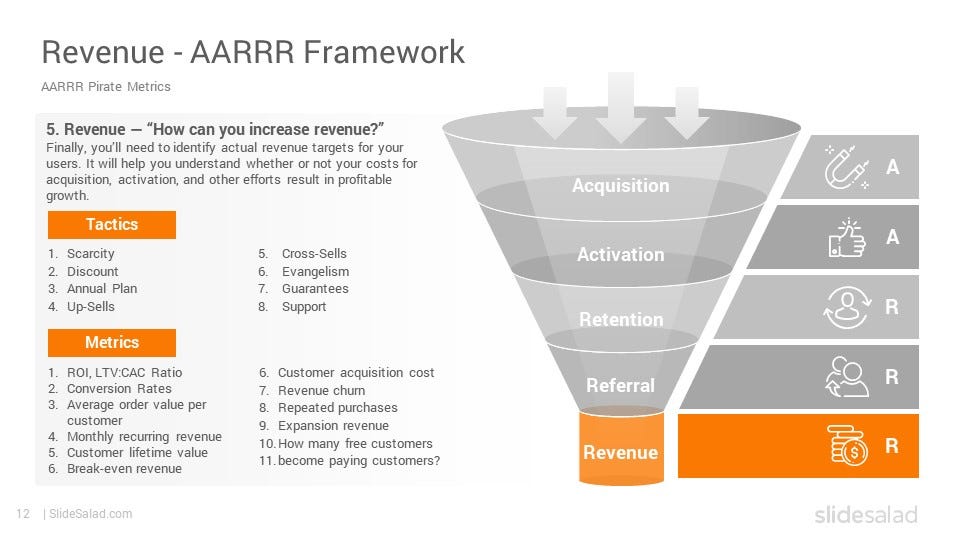
Revenue generation is the backbone of any business. The revenue component of the AARRR framework focuses on optimizing monetization strategies and driving profitability.
Here are some key metrics to consider:
- Average Revenue per User (ARPU): ARPU calculates the average revenue per user, helping identify high-value customers for targeted marketing and upselling strategies. Elevating ARPU directly influences the bottom line.
- Customer Acquisition Cost to Lifetime Value Ratio (CAC:LTV): It provides insights into the overall profitability of your customer acquisition efforts. A low ratio between acquisition cost and customer lifetime value indicates healthy growth and sustainable revenue.

Conclusion
- The AARRR framework and product metrics provide a comprehensive roadmap for businesses to unlock growth potential.
- By analyzing acquisition, activation, retention, revenue, and referral, organizations can obtain valuable insights into customer behavior, optimize their strategies, and drive sustainable growth.
- Remember, data-driven decision making is the key to success in today’s highly competitive business landscape. So, harness the power of product metrics, identify areas for improvement, and propel your business forward with confidence!
“Measure, iterate, and conquer the path to success!”
