Dear Reader,
As discussed in the last newsletter, product-market fit is the leading cause of product failures. So it is vital to quantify product-market fit. It’s too important not to :)
In July 2011, Rick Marini launched a facebook app for professional networking , BranchOut. LinkedIn, the largest professional network app, had just went for IPO May 2011 at a $7.8 B market cap, so what was so different about BranchOut?
TechCrunch wrote about BranchOut at the time,
Search on a company name and see which of your Facebook friends work there or used to. If those friends have installed the app, you can also see how many of their friends have worked at that company. You can then reach out to them for an introduction if you like.
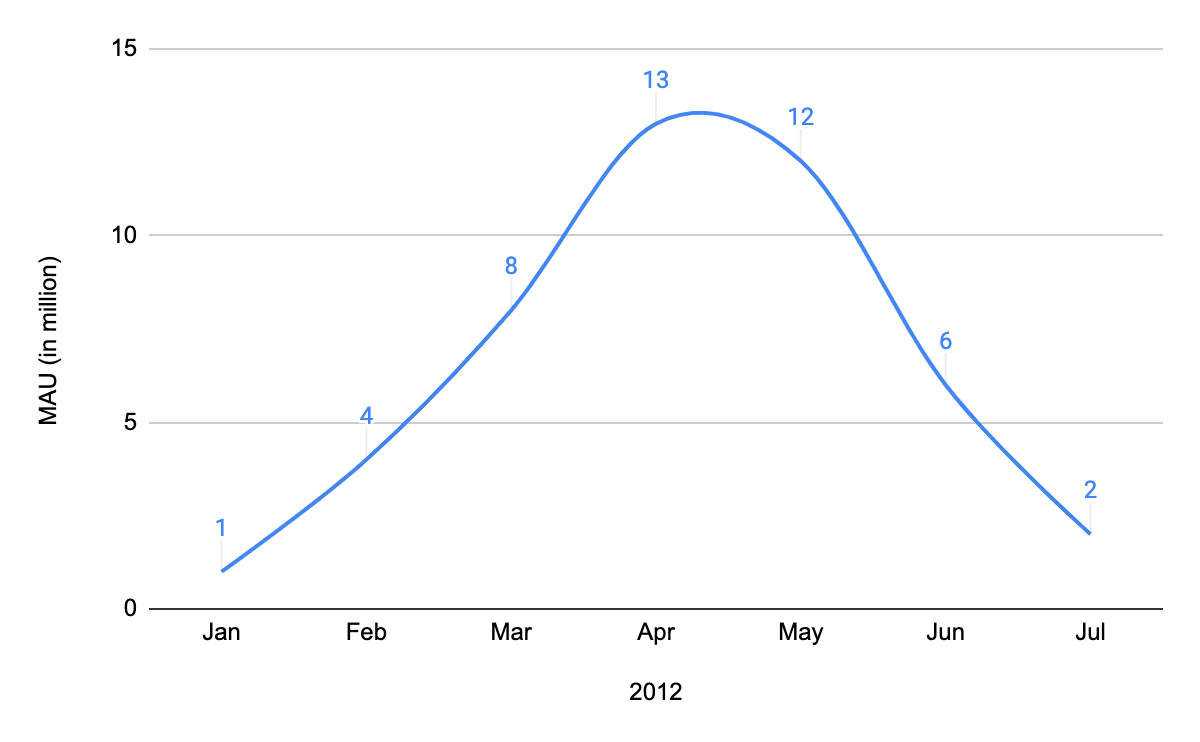
In a way, it was LinkedIn for Facebook. The underlying thesis was that using social graph can fundamentally change many businesses including recruiting. And the investors actually liked it, BranchOut secured $6 million in series A just one month after launch. By April next year, the startup had raised $49 million in total. As you see in the chart below, it got massive growth between Feb-Mar 2012 which is investors’ dream.

BranchOut MAU in Feb-Mar 2012 before Series C, $25 M round
However, the growth soon started slowing down. The MAU numbers kept decreasing. This is how 2012 looked for BranchOut.

Rise and Fall of BranchOut MAU: A Nightmare for Growth
Despite all efforts by Rick Marini including a pivot, the company had to sell its assets at $5.1 million in August 2014 to 1-page much lower than the total amount they raised.
BranchOut is often told as a cautious story of growth. As it happens with stories, there are multiple versions on why it failed. Let’s do the postmortem from a product-market fit lens. As I wrote in this post
Product/market fit means being in a good market with a product that can satisfy that market.
There are two key terms in the definition – first one is ‘good market’ and the second one is ‘product that can satisfy the market’. A good market is the one that is big in numbers and still growing, both in terms of customers and spends.
A product that can satisfy the market is the one that solves a market need and makes money while doing so.
To summarise, you need both a good market and a good product for product-market fit.
Good Market : Solid user acquisition numbers usually prove there is a good market. During the first 5 months, BranchOut acquired lots of new users, 33 million to be precise. They did this by showing invite prompts that preselected friends, maximum of 50 friends which was Facebook set. There were only two options, either invite everyone or invite no one at all. This strategy was very effective and BranchOut invites reached hundreds of millions of FB users. Please note that LinkedIn had 50 million users by 2009, 6 years after it launched first in 2003. So BranchOut getting 33 million users in 8 months is a pretty amazing thing.
Good Product: What do you do when you like using an app? You keep using it. If a large chunk of those 33 million users for BranchOut come back and use the product on a regular basis, it could be called a good product. Unfortunately, that didn’t happen.
We measure a good product through retention, defined by returning users/ acquired users for a particular period.
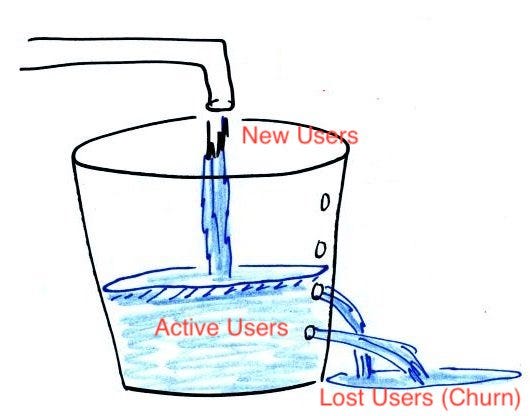
The concept of leaky bucket: Retention, leading indicator for a good product, can be best understood best through the concept of a leaky bucket. Say you put a leaky bucket below the tap. The water flowing in is the new users, the water flowing out is lost users and the water still retained in the bucket is active users. Any and every product should keep focussing on growing the active users. All products are leaky buckets. No product can hold all the customer coming in and so the size of the holes matter.

Explaining Retention through a leaky bucket
What kind of difference can retention create? Here is a comparison of two products acquiring 3 million users/month for 12 months. For the sake of simplicity, we have taken monthly retention rate as constant. In reality, it keeps reducing over months.

Two products with same # of registered numbers with different retention rates
As you can see, retention rate can create huge gap between companies’ monthly active user (MAU) base. This gap will only become bigger over time, making the first one a huge success while the other one a cautionary tale. This is why, retention along with healthy acquisition is the leading indicator of product-market fit and one of the most important metric to track for product success.
To conclude, new user acquisition rate will tell you about the market. Retention rates will tell you about whether your product fits the market. With this, I will wrap this up and share with you some articles to go through this week. Click the title of articles (in green) to open the links and read them:
- The best metric to determine product-market fit by Jeff Chang, Growth leader at Pinterest
Prior to product market fit, you should be focused on making the product better for your existing users. When a product has “product market fit”, it means that the product is good enough to start shifting focus from improving the product to growing distribution channels. If you distribute a product that isn’t great, even if you are able to get a lot of initial users, a few months down the road your user base won’t grow significantly or may even decline. So, you can also think of product market fit as “time to start building scalable acquisition channels”.
- How to determine product-market fit using cohort retention analysis by Travis Kaufman, VP Product Growth at Gainsight
When your product has achieved product market fit, your user retention will flatten out over time. If the line trends towards zero, users are not realising value in your offering and not returning back to your product. This trend line down to 0 is also described as a having leaky bucket. No matter how good your customer acquisition is, ultimately you’re in trouble if you cannot deliver value and keep users coming back.
- The value of keeping the right customers by HBR
Depending on which study you believe, and what industry you’re in, acquiring a new customer is anywhere from five to 25 times more expensive than retaining an existing one. It makes sense: you don’t have to spend time and resources going out and finding a new client — you just have to keep the one you have happy. If you’re not convinced that retaining customers is so valuable, consider research done by Frederick Reichheld of Bain & Company (the inventor of the net promoter score) that shows increasing customer retention rates by 5% increases profits by 25% to 95%.
