I recently shared this Tweet:
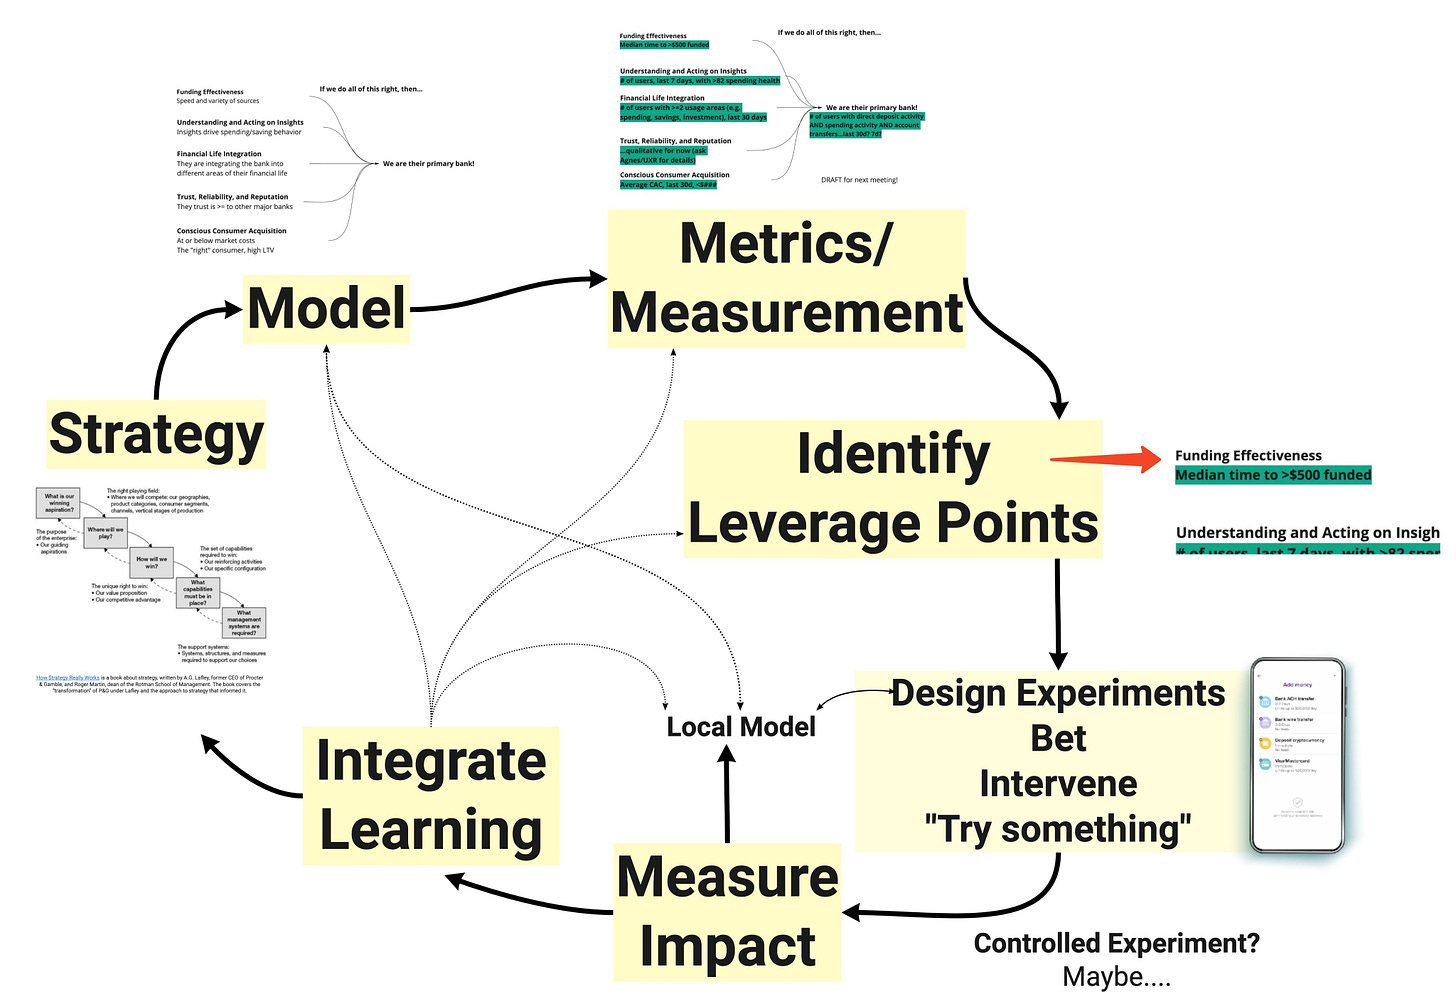
Most teams jump from high level strategy/goals straight to feature ideas (w/ “success metrics”) The most successful teams 1. Have a strategy 2. Translate that into models 3. Add minimally viable measurement 4. Identify leverage points 5. Explore options 6. Run experiments
Along with this image:
A number of people asked me to write about it. Here goes!
Data-informed product is a loop (or series of loops).
We (hopefully) start with a Strategy
Good strategy has a simple logical structure I call the Kernel. These three elements are (1) a clear-eyed diagnosis of the challenge being faced, (2) an overall guiding policy explaining how the challenge will be met, and (3) a set of coherent actions designed to focus energy and resources. (Rumelt)
Next we develop/select various context-appropriate Models.
The SEBoK lists the following definitions for models:
- a physical, mathematical, or otherwise logical representation of a system, entity, phenomenon, or process (DoD 1998);
- an abstraction of a system, aimed at understanding, communicating, explaining, or designing aspects of interest of that system (Dori 2002)
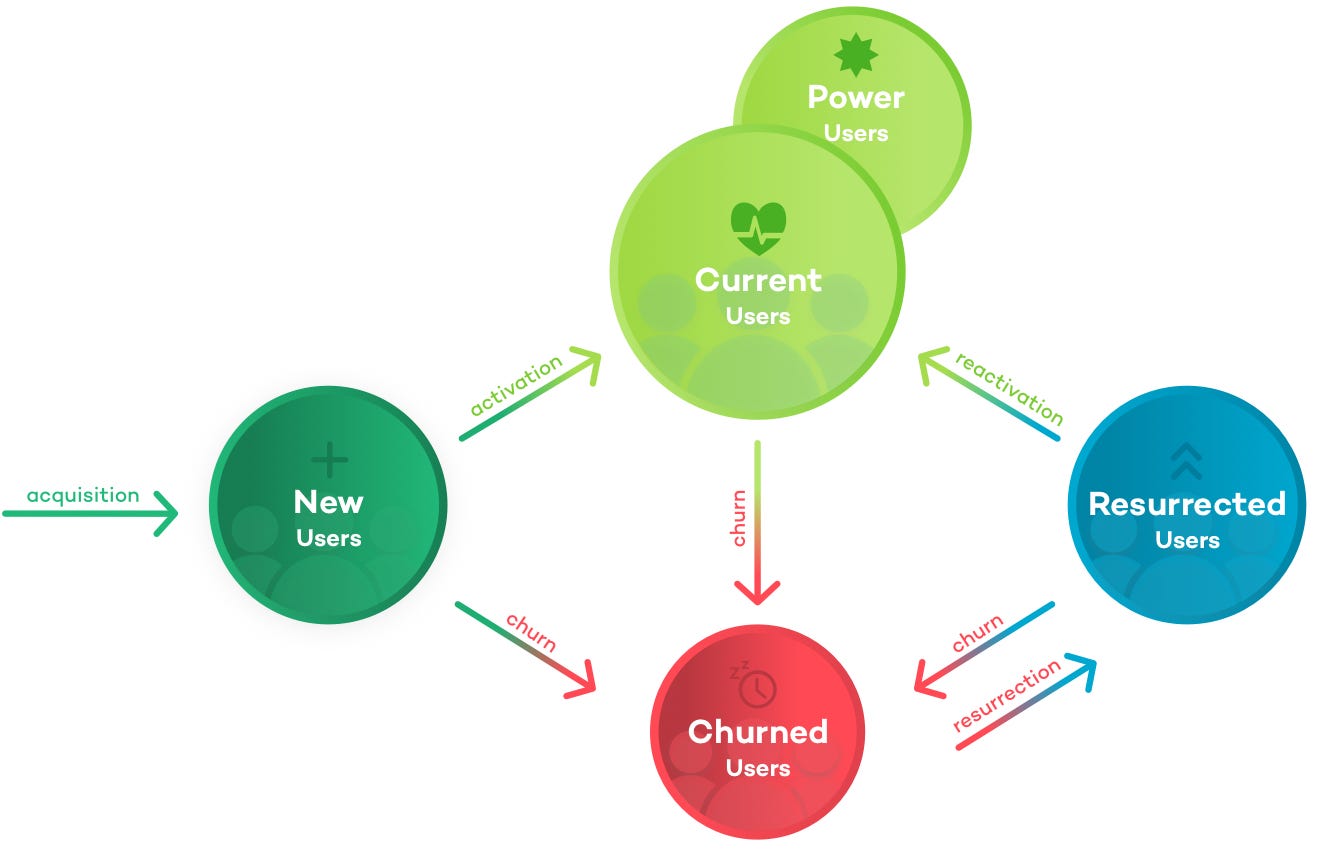
For example, this high-level model helps us wrap our heads around retention:
Basic…but it does a job.
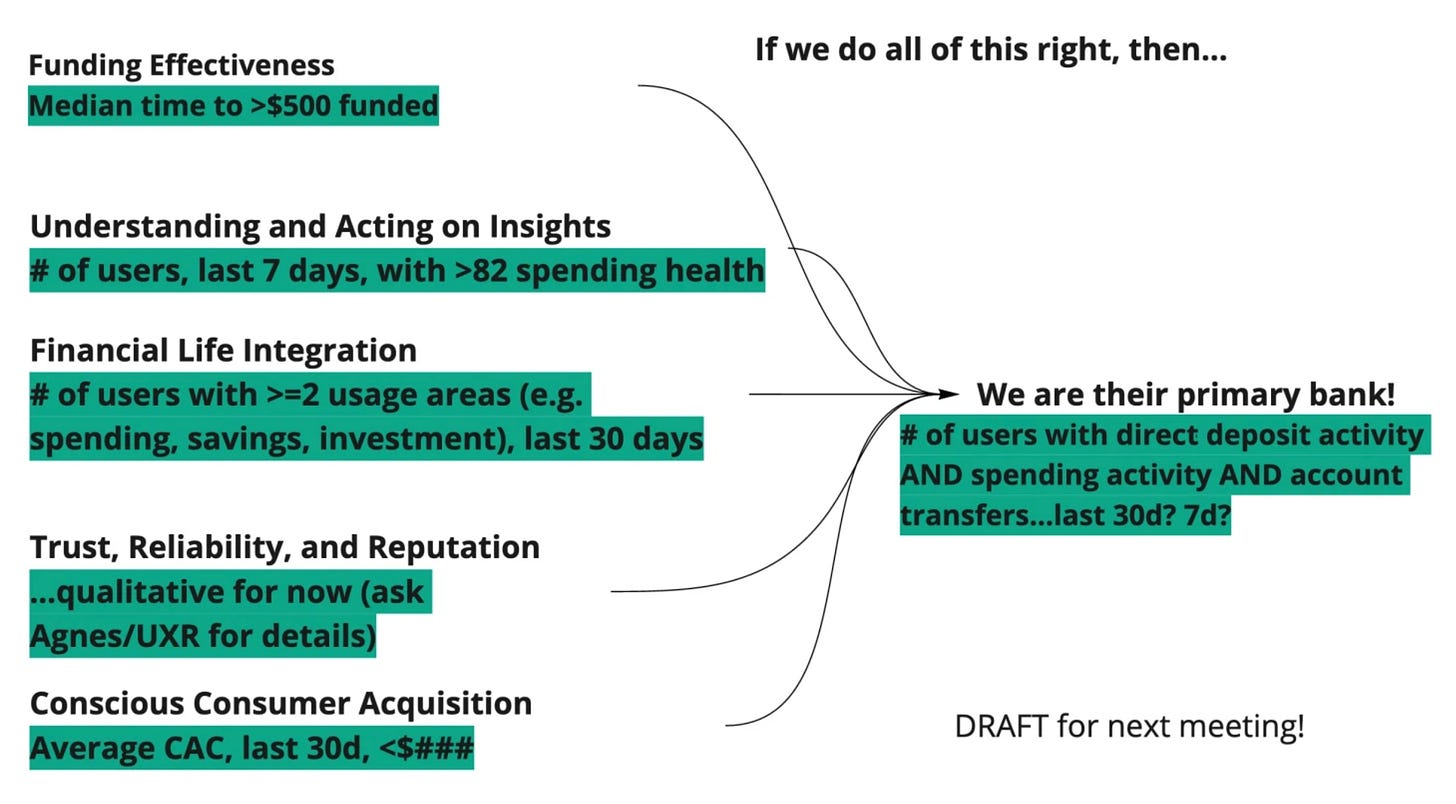
The North Star Framework is a model that identifies a constellation of variables (and associated metrics) that together serve as a leading indicator of sustainable, differentiated product growth.
Ideally, these variables are unique to your strategy.
Customer LTV models, journey maps, value chains, driver trees, capability maps, Wardley Maps, hypothesis trees, belief maps, and causal relationship diagrams are all examples of potentially helpful models. Here are some prompts that can help you develop models.
A topic for another post, but the models you use and socialize are probably AS important as your strategy.
Why are models so important? They help orient us, and encourage more effective conversations. You can’t just run off and copy-paste every model you see, however. They are a starting point. “Essentially, all models are wrong, but some are useful.” (George Box)
Most organizations skip developing a product strategy, and use models that aren’t very actionable for actual product work (e.g. high-level financial inputs/outputs). We don’t want that! If we skip strategy and models, we’ll end up with a bunch of roadmaps filled with features. Get more specific. Go down a level or two.
Next we layer in Metrics and Measurement.
Have you ever looked at an executive dashboard filled with charts (or spreadsheet filled with numbers), and had no clue how it all fit together? What were the metrics trying to proxy? How were they related? What were the underlying assumptions? It’s frustrating.
When we start with models, we can take a different approach. Given our various models, how do we measure the things that really matter? How do we measure the parts of our model(s)?
Tip: Make sure to read How to Measure Anything: Finding the Value of Intangibles in Business by Douglas Hubbard. Teams can get very stuck when it comes to measurement.
Next we identify Leverage Points.
With our wrong by useful models in place – and ideally some measurement attached to the model – we’re in a good place to identify where to focus our efforts. Donnella Meadows describes leverage points as:
[The] places within a complex system (a corporation, an economy, a living body, a city, an ecosystem) where a small shift in one thing can produce big changes in everything.
Using our product lens, a leverage point might be a stage in a funnel, a variable we think we can improve by 2x, an unexplored flywheel, a bunch of small usability issues that add up, or even an area of curiosity that might help us unravel a longstanding product mystery. Basically, wherever we can focus to multiply our energy/time investment.
Great, we’ve identified a good place to focus! And we’ve already identified some ways to measure that part of the model!
Next comes designing and Placing Our Bet, building a feature, or simply “trying something”.
We can use data to inform our designs and approach.
When that thing “ships”, we set about understanding how it impacted things that matter (our various models, and strategy). We Measure Impact. This might involve something like a controlled experiment. Or might not.
Finally, we Integrate Whatever We Learn back into our strategy, and models. We revisit our approach to measurement, and how we measure impact. And we inform our next bets.
Key Points:
- You need a strategy
- Most product strategies are too high level. They say everything and nothing at the same time.
- Many organizations suffer from a “messy middle” problem. They go from insanely high-level business goals and metrics (yay exec dashboards!), straight to features on a roadmap. Models help us fill that gap. I’ve referred to these in the past as persistent models in the past.
- Go for a mix of generic models that are specific to your industry/business-model, and specific models that are more unique to your actual company.
- If you don’t update your view of things based on what you just learned, then you’ve sort of missed the point.
- To get better at data-informed product you have to keep going around the loop. It takes practice (and psychological safety and support).


