Work with data in BigQuery

1. Learn to choose specific columns from table, using google_political_ads public dataset and advertiser_stats table in this dataset.

Click on Add data > Explore public datasets > Search and enter political advertising on Google. Explore the tables to understand the data you will query. The basic SQL query contains a SELECT statement, then the list of columns you want to select and FROM statement to indicate where you want to choose your columns from. Construct the table address for the table in BigQuery as: your-project-name.your-dataset-name.your-table Use this query to select unique region values from the advertiser_stats table in bigquery-public-data.google_political_ads dataset: SELECT distinct regions FROM `bigquery-public-data.google_political_ads.advertiser_stats`

2. Use SQL aggregate functions to summarize the rows of a group into a single value.

Some basic aggregate functions are: COUNT: Calculate the number of elements. COUNTIF: Calculate the number of elements with a condition. SUM: Sum. AVG: Average. MIN: Minimal value. MAX: Maximal value. Use a GROUP BY statement with your aggregate function. Try this query: SELECT regions, sum(total_creatives) as creatives FROM `bigquery-public-data.google_political_ads.advertiser_stats` GROUP BY regions ORDER BY creatives DESC total_creatives: total number of election ads the advertiser ran with at least one impression; regions: list of regions where the ads of this advertiser were served. In this query we get the number of ads impressions per region or group of regions, and then we sort the table by the number of impressions to see the most important regions first. Use AS to name a column.

3. Filter the columns you chose to have only relevant data in your query result.

Use the WHERE function to filter the data you want to display in your query result: in the previous query add the WHERE regions = "US" after the table address to get impressions for US only. SELECT regions, sum(total_creatives) as creatives FROM `bigquery-public-data.google_political_ads.advertiser_stats` WHERE regions = "US" GROUP BY regions ORDER BY creatives DESC Replace the WHERE statement with WHERE regions like "%EU%": SELECT regions, sum(total_creatives) as creatives FROM `bigquery-public-data.google_political_ads.advertiser_stats` WHERE regions like "%EU%" GROUP BY regions ORDER BY creatives DESC Try your own WHERE filter with one of these basic WHERE expressions: =, >, =, <=, STARTS_WITH(column, 'value')  OR, AND IN('value', 'value', ….), NOT IN IS NULL, IS NOT NULL BETWEEN, NOT BETWEEN X AND Y LIKE "%x%"

4. Use CASE WHEN function to rename or replace values if a condition is respected.

Use CASE WHEN statement to change your data in the query result to make it more clear for those who’ll see the result table. Syntax: CASE expr WHEN value THEN result [WHEN ...] [ELSE else_result] END Try this query replacing regions in the previous query by: CASE WHEN regions LIKE "%EU%" THEN "Europe" WHEN regions = "US" THEN "United States" ELSE "Other" END as regions, And deleting WHERE clause: SELECT CASE WHEN regions LIKE "%EU%" THEN "Europe" WHEN regions = "US" THEN "United States" ELSE "Other" END as regions, sum(total_creatives) as creatives FROM bigquery-public-data.google_political_ads.advertiser_stats` GROUP BY regions ORDER BY creatives DESC

5. Use table advertiser_weekly_spend with its date field week_start_date to test date functions.

Try this query to calculate the spend, available in spend_inr field, per week: SELECT EXTRACT(Week FROM week_start_date) AS week, SUM(spend_inr) AS money_spend FROM `bigquery-public-data.google_political_ads.advertiser_weekly_spend` GROUP BY week In this query we use EXTRACT(Week FROM week_start_date) to analyze to get only the week number. Try the next query transforming week_start_date to the Month rounding the date to the first of every month: SELECT DATE_TRUNC(week_start_date, MONTH) AS Month, SUM(spend_inr) money_spend FROM `bigquery-public-data.google_political_ads.advertiser_weekly_spend` GROUP BY Month ORDER BY Month Create your own query with some basic date functions: EXTRACT(year/month/day/week/weekday FROM orderDate) DATE(orderDate) : DATE(DATETIME…/DATE(TIMESTAMP ) DATETIME(orderDate) CURRENT_DATE() DATE_ADD(DATE ..., INTERVAL 5 DAY) DATE_SUB(DATE ..., INTERVAL 5 DAY) DATE_DIFF(DATE '1', DATE '2', DAY/WEEK/MONTH/QUARTER) DATE_TRUNC(date_expression, DAY/WEEK/MONTH/QUARTER) FORMAT_DATE("%b-%d-%Y", DATE "2008-12-25")  = Dec-25-2008 PARSE_DATE(format_string, date_string) ex. PARSE_DATE("%x", "12/25/08")

6. Learn to use JOINs and UNION ALL functions to analyze data from several tables.

Add one table to another by using UNION ALL: SELECT * FROM `table_2019` UNION ALL SELECT * FROM `table_2020` To use UNION ALL, the table must have the same column. Use JOINs when the columns you want to analyze are in two or more tables: Choose the table you want to join. The type of join like LEFT or RIGHT. Name the tables in the query to use this name with the fields, to indicate from which table you extract this column. Use ON or USING to indicate the common field in two tables. Join advertiser_stats and creative_stats to get the number of specific URLs (ad_url) used in ads per advertiser. SELECT ad.advertiser_name AS advertiser, COUNT(ad_url) AS URLs FROM `bigquery-public-data.google_political_ads.advertiser_stats` ad JOIN `bigquery-public-data.google_political_ads.creative_stats` cr ON ad.advertiser_id = cr.advertiser_id GROUP BY advertiser Try to create your own query using different types of JOINs depending on the data you want to prioritize: Image 8
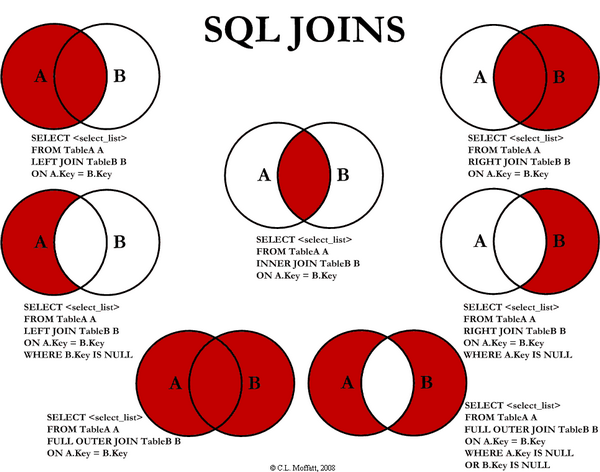
https://www.codeproject.com/Articles/33052/Visual-Representation-of-SQL-Joins

7. Learn to work with nested and repeated fields in BigQuery.

Nested and repeated fields are how BigQuery maintains denormalized data. Nested fields are the table inside your table: Find the example of nested fields in google_analytics_sample dataset: To query this type of data, you need the UNNEST function. Try out this query to get the destination pages for Google Analytics sessions, the pages are in the hits table inside big analytics table ga_sessions: SELECT hits.hitNumber AS hitNumber, hits.page.pagePath AS pagePath FROM `bigquery-public-data.google_analytics_sample.ga_sessions_*`, UNNEST(hits) as hits WHERE hits.hitNumber = 1 GROUP BY hitNumber, pagePath

8. Create a table, a view, or a scheduled query based on your query.

Save your query if you need to run it periodically. Save a view if you want to address the query result as a table. You can query a view as you would query a table, but it’s not a real table so it doesn’t use any storage. Save one of your queries. When saving your query choose if you want to make it personal or available on the project level, so your colleagues can see it: Create a view based on one of your queries. When you create a view you need to specify project, dataset, table, and give your table a name: This is how the view looks: Create a real table based on your query if you need one, for example, you want to delete your old table that your query is based on, so you create a new table with the data you need: Schedule a query if you want it to run it regularly, to get the fresh data and feed your existing table: Choose the periodicity. Choose the destination. Click on SCHEDULE.