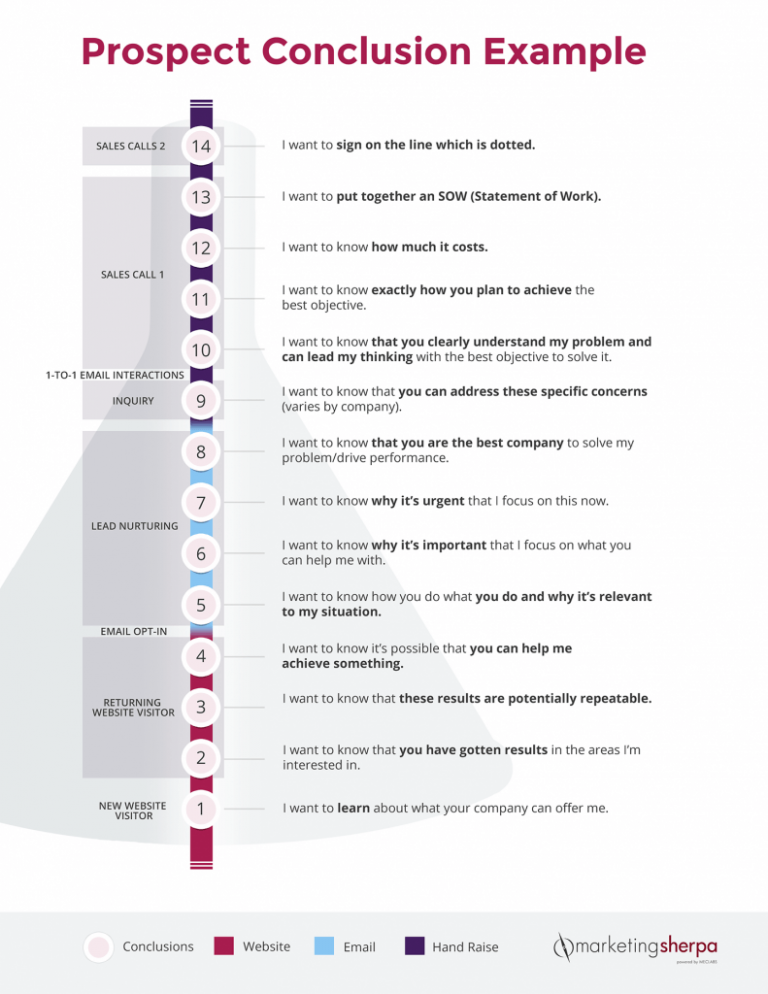
Visualize the conversion journey

1. Use the Simplified MECLabs Institute Data Pattern Analysis Tool to enter data or Google Analytics and enter screenshots of the funnel to see the customer’s experience.

Use the data to understand what the customer is thinking and their behavior patterns.  What does the data say about the primary behavior? Is there something in the data that is highly plausible or highly unlikely? Do the patterns indicate limitations you can turn into opportunities?

2. Print out each step of the customer journey and hang it on the walls of a meeting room or your office.

3. Write the metrics, or potential conversion changes, on each step of the journey and note what the difference is.

4. Create a customer journey map to show the questions potential customers have, and map the marketing or sales materials and interactions you can use to address these questions.

Identify as many distinct customer profiles as necessary to determine your ideal customer. Create a list of preliminary customer insights – What do the customers themselves want? Categorize the preliminary insights into attributes, context, desires, and fears to understand the customer’s reality. Generate unanswered questions (assumptions) about the customer’s identity and behavior to build a knowledge base about the customer that you can answer as you learn them.

5. Create a prospect conclusion funnel to identify the key conclusions customers need to reach to keep traveling along the journey with your company and ultimately make a purchase.

For each step in the funnel, express the value of your offer relative to their place in the buying journey. 
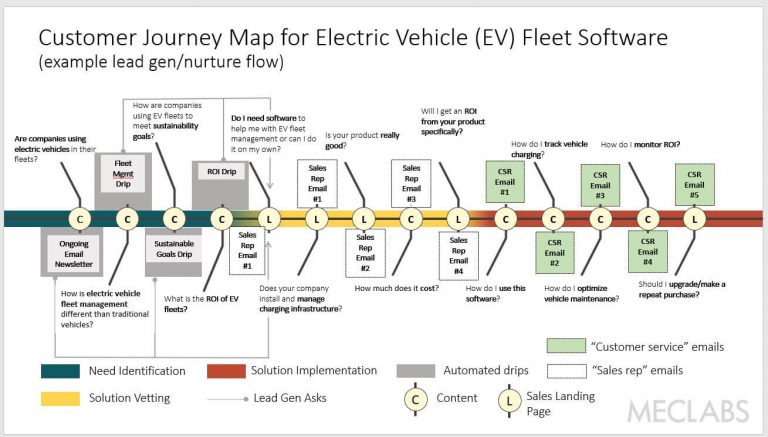
Identify the paths the customer uses to purchase and how you can use your marketing, sales, and other resources to help them make that decision.

6. Share the customer journey map and prospect conclusion funnel with your internal and external creatives, so you are all on the same page about your ideal customers.