Track segments in Google Analytics

1. In Google Analytics, click on Behavior > Site content > All pages report and click +Add Segment, then select a pre-built segment to use and click Apply.

If you can’t immediately identify a use case for segments, follow the examples below.

2. Add segments for converters and non-converters and compare these segments by device category, age group, and specific page visited.

Go to Audience > Mobile > Overview and compare the two segments by device category. For example, if fewer converters use mobile devices, you might need to optimize your website for these devices. Go to Audience > Demographic > Age to find the share of converters and non-converters by age category. Use this information to tailor your targeting – for example, exclude or add specific age groups in your Facebook or Google Ads campaigns. Go to Behavior > Site content > All pages to find the number of converters and non-converters broken down by specific pages. Use this data to inform your content strategy – for example if you have a blog on your website you can identify the pages visited by converters and create similar content.

3. Go to Behavior > Site content > All pages and add Multi-session Users and Single Session Users segments.

Identify pages which have a high share of page views generated by multi-session users. Use this data to learn which content resonates with your frequently returning visitors and create similar content to drive user loyalty.

4. Go to Behavior > Site content > Landing pages and add Mobile traffic and Tablet and desktop traffic as segments.

Check the bounce rate metric and identify the pages with high bounce rate on mobile devices (higher than the website average on mobile). Consider sending users to other, better performing landing pages by adjusting links in your ads.

5. To create a custom segment, click +Add Segment and +New Segment and click on Conditions.

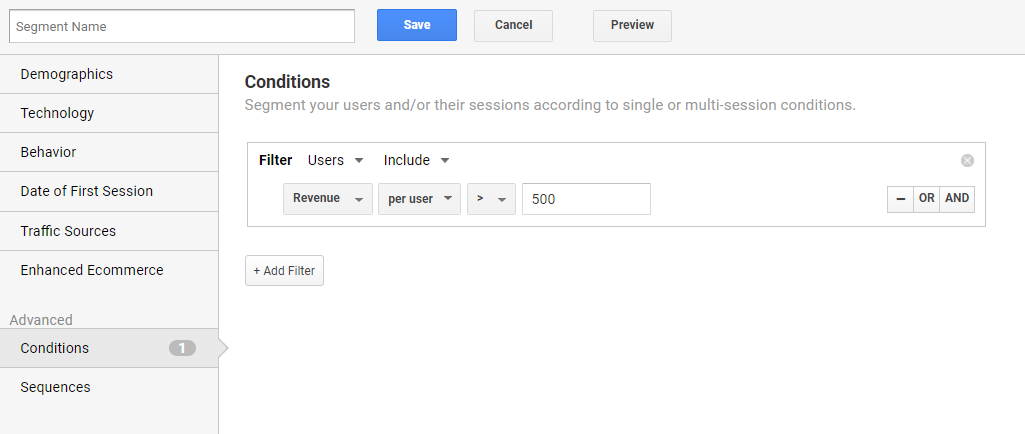
Construct conditions using the dropdown lists – these vary according to the dimension selected. For example, if you wanted to analyze high-spenders, you could filter users who generated revenue exceeding $500: Select Users and Include from the top dropdown lists. Select Revenue from the Dimensions dropdown list. Select per user from the Comparison dropdown list. Select > from the Operators dropdown list. Enter 500 in the text box. Apply these segments to a number of reports to better understand high spenders: Where they come from. Which demographics they represent. How they found your website.