Track and mitigate uplift decay

1. Make a full backup of your website (or specific pages of interest) every six months. Try to preserve as many features as you can.

2. If you suspect winning A/B tests from the past suffered from uplift decay, investigate the reasons by making a list of all tests and rolled-out features from the past six months that led to the current version of the website or page you are analyzing.

Uplift decay is when an A/B test variant successfully brings improvements to your target metric, but the improvements vanish over time.

3. Check for novelty effects. Take the results of the A/B tests from the list you made and use your analytics tool to segment them between new and returning visitors.

Novelty effect is the tendency for pages that received new features to see an initial boost in performance which fades away as time passes. This happens when the boost is not caused by improvements brought by the new features, but by returning visitors showing an increased response because there is now something new in their experience. If the performance in the A/B tests from your list was similar in both groups – new and returning visitors – then novelty effects are likely not the culprit. If performance was visibly better for returning visitors in any given test, then novelty effects might have taken place for that test and could be responsible for the uplift decay you observed in your target metrics. In this case, re-run the A/B test to validate this hypothesis, this time only including returning visitors as your target audience.

4. Check the live implementation of previously tested winning pages against the implementation done for the variants used in their respective tests to rule out confounding effects of technical nature.

Check functionality and layout to ensure that the user experience is identical between the version of the page that won the test and the version that went live. If there are noticeable differences between the tested version and the live version, this could be causing the observed decay.

5. If the previous steps could not explain the observed decay in your key metrics, create an uplift decay analysis spreadsheet with columns for each past test to look for patterns.

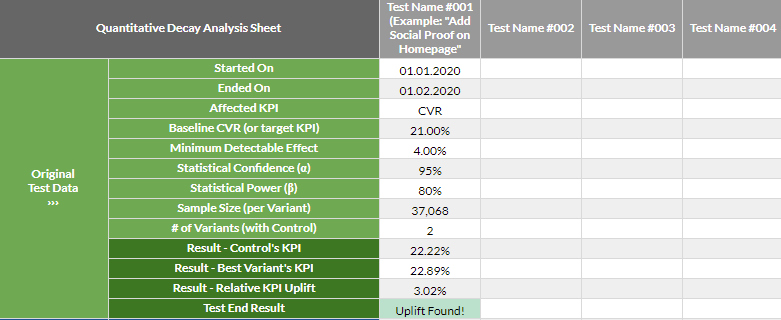
Create a sheet (tab) for the quantitative decay analysis. 
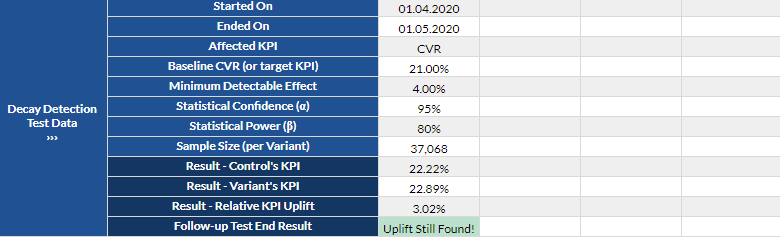
Label rows for test start, test end, affected KPI, baseline conversion rate (for the affected KPI), minimum detectable effect, statistical confidence level, sample size per variant, number of variants (counting control), test result: control’s KPI, test result: the best variant’s KPI, test result: relative KPI uplift. Create another sheet (tab) for the qualitative decay analysis. Document your findings and look for patterns that might have led to an uplift decay, like environmental factors, customer behavior changes, new audiences, technical issues, new competitors, website changes, and other tests that ran at the same time. Alternatively, use an uplift decay analysis template.

6. If this still does not explain the observed decay, use your backup to run one or more decay detection A/B tests against the current version of your website or page of interest.

To detect the aggregate amount of decay suffered by all A/B tests that ran in the past six months: create a site-wide A/B test comparing the current version of the website (Control) to the six-month old version (Variant). To detect the decay suffered by A/B tests that ran in specific pages of interest: create an A/B test comparing the current version of the page (Control) to its six-month old version (Variant). In both cases, you can select which features to keep or discard from the six-month old version (Variant) when running the decay detection A/B test. This can achieve more accurate data to validate whether the features you kept are responsible for the observed decay. Run your tests for a full business cycle. Plan the test duration so that you have a statistically significant sample size on the stopping date and aim for a significance level of 95% to mitigate the odds of finding imaginary uplifts.

7. After the tests are done, create another section in the spreadsheet to track the decay detection test data. Compare the performance of each variant with its respective control version.

On your quantitative decay analysis sheet (tab), add the same test indicators you have for the original test data from step 5 in the rows below. If the difference in your main KPIs doesn’t favor the Control version (currently online) or if the difference between Control and the 6-month old backup version is considerably smaller than before, then uplift decay took place: features that performed well in the past could be hindering performance now. Use previous sheets and your analytics tool to segment the results of tests. Try to spot patterns that led to the uplift decay and verify statistical significance for each segment: Device (a bigger share of journeys starting on mobile after the test rollout is a common culprit) Viewport size Browser Time of the day Traffic sources Region Use the identified patterns to inform your hypotheses in future A/B tests in order to mitigate the chances of uplift decay happening.