Track a sales funnel with GTM and GA

1. Setup your GTM container to track ecommerce events.

Google Analytics ecommerce events you create through GTM, will be displayed on the ecommerce reports automatically. The type of event to measure will depend on the type of business and business goals. You can choose from product impressions, product clicks, product detail impressions, add/remove to cart, promotions impressions, promotion clicks, checkout steps, purchases, and refunds.

2. Enable ecommerce features in Google Analytics.

Within Google Analytics settings, at a view level, enable the ecommerce and enhanced ecommerce reporting under Ecommerce Settings.

3. Label your checkout steps in the previous settings.

If your checkout is set up with more than 1 event due to your checkout process consisting of more steps, you can use this feature to rename those steps. By labeling your checkout steps you can change the default GA names according to your business needs. If your checkout process consists of 3 steps: Billing, Payment, and Review, you can replace the default Google Analytics names with your business terminology.

4. Analyze the overall sales journey under E-commerce > Shopping Behavior.

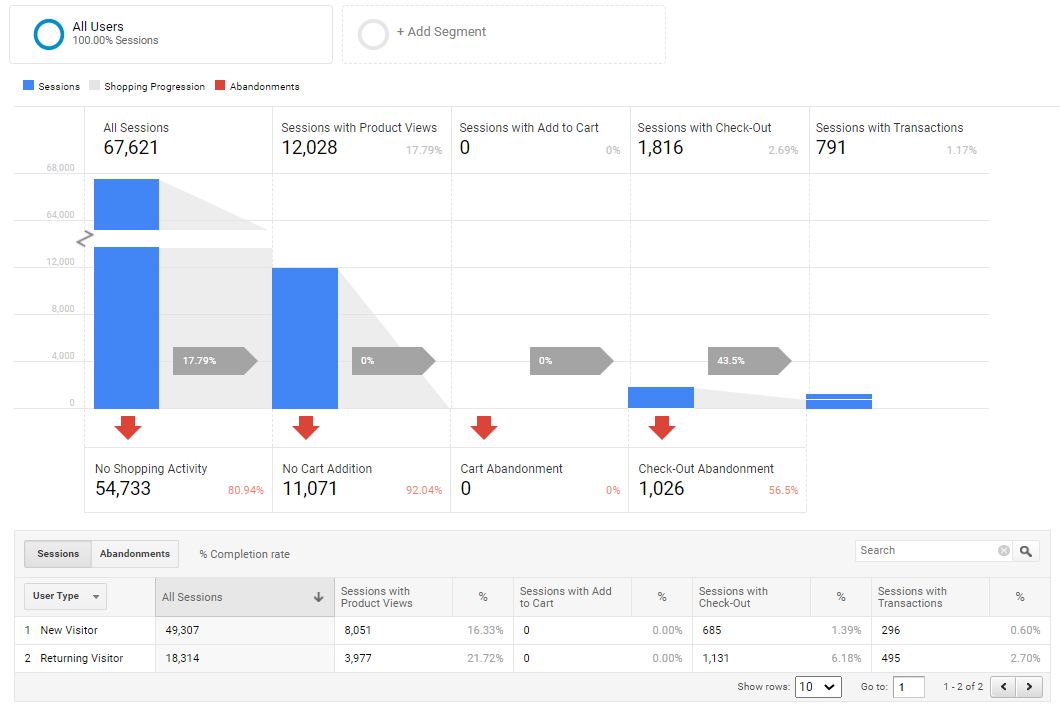
This report allows you to comprehend the overall sales process, starting at the number of sessions that visited the site, followed by those who saw products, added products to the cart, started the checkout process, and finally made a purchase, in order to understand the sales process, possible issues, and find optimization opportunities.

5. Analyze the checkout process prior to sale. Within Conversions Report under Ecommerce, go to Checkout Behavior.

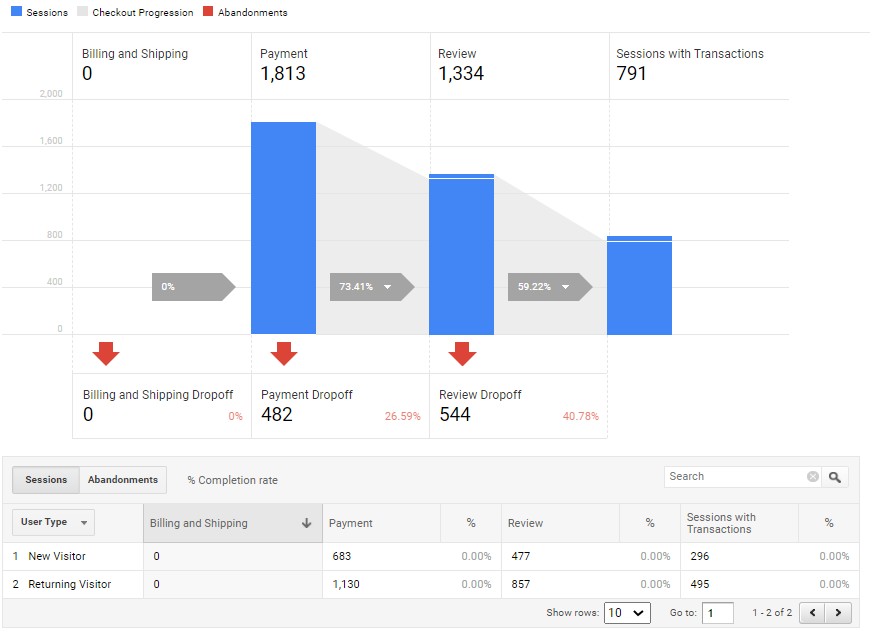
This report deepens the last steps of the sale. If a checkout process consists, for example, of filling in information regarding address, payment, and review, it allows you to detect if some of your users are leaving before completing some data.

6. Analyze the composition of the sales. Within Conversions Report under E-commerce, go to Product Performance.

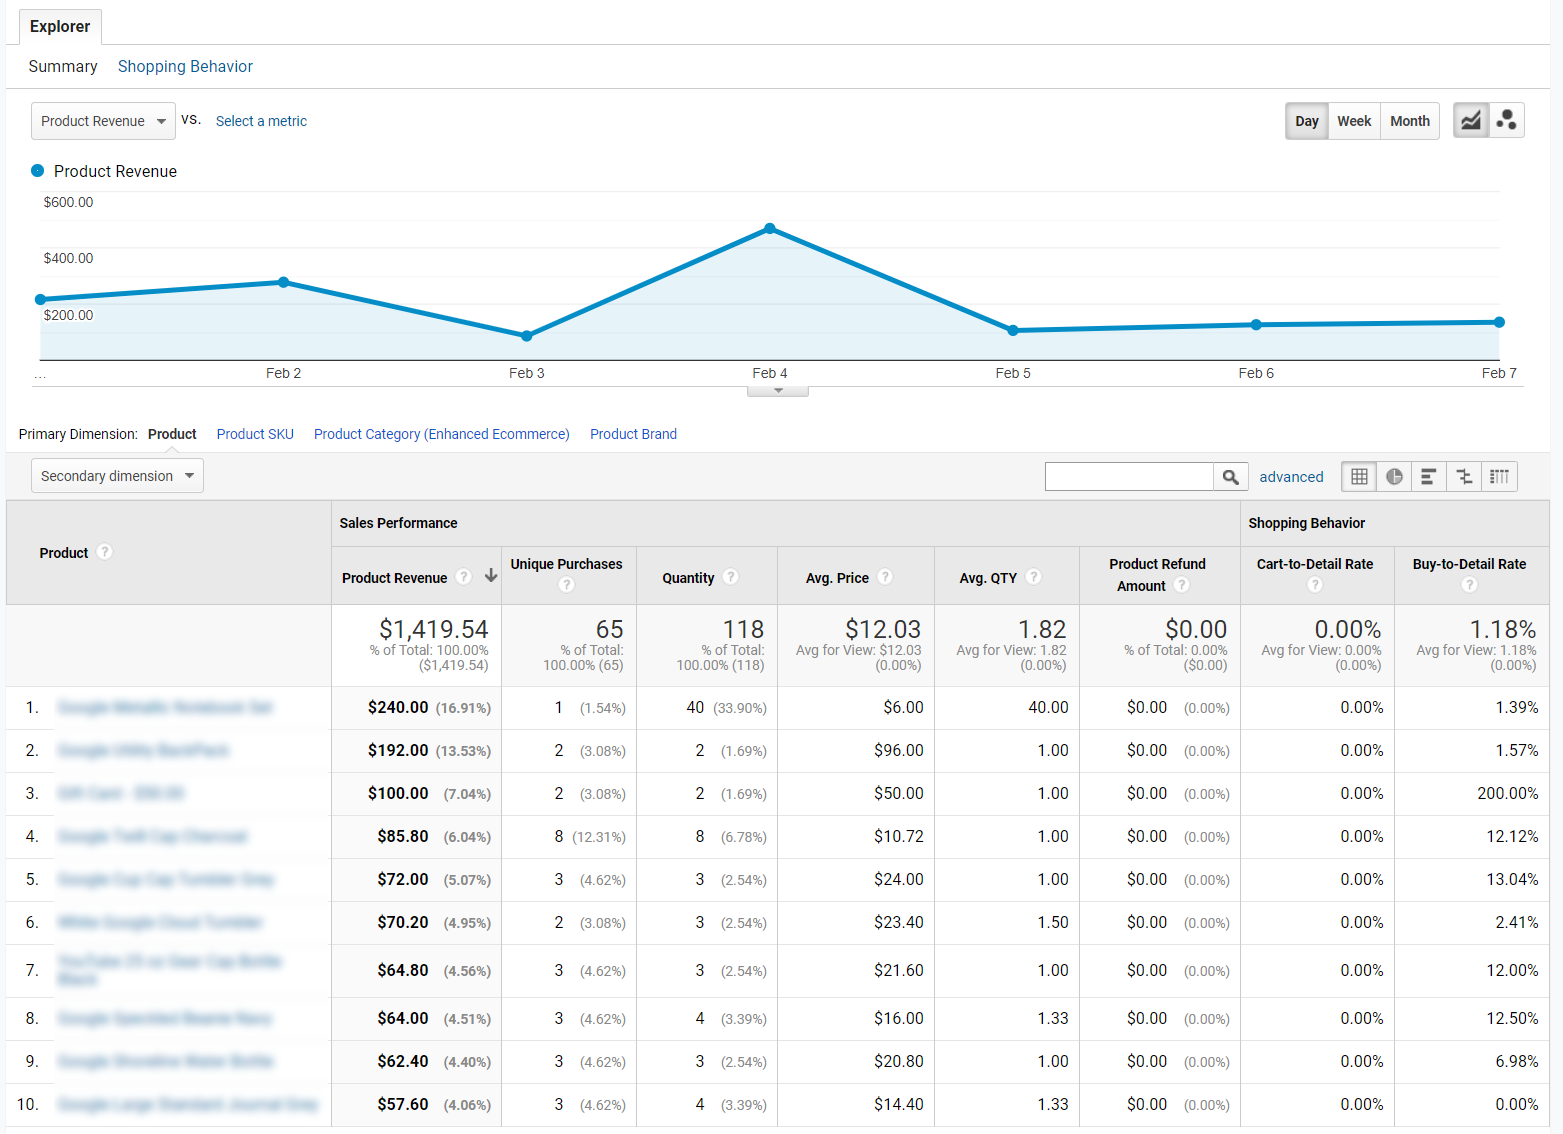
Product Performance report shows you results regarding each product. The main metrics are Product Revenue, Quantity, and Avg. Price of the products. You can add secondary dimensions to break down your analysis by a product feature you are measuring or by campaign, to find out if some campaigns are driving more sales.

7. Evaluate sales along with their respective costs. Within Conversions Report under E-commerce, go to Sales Performance.

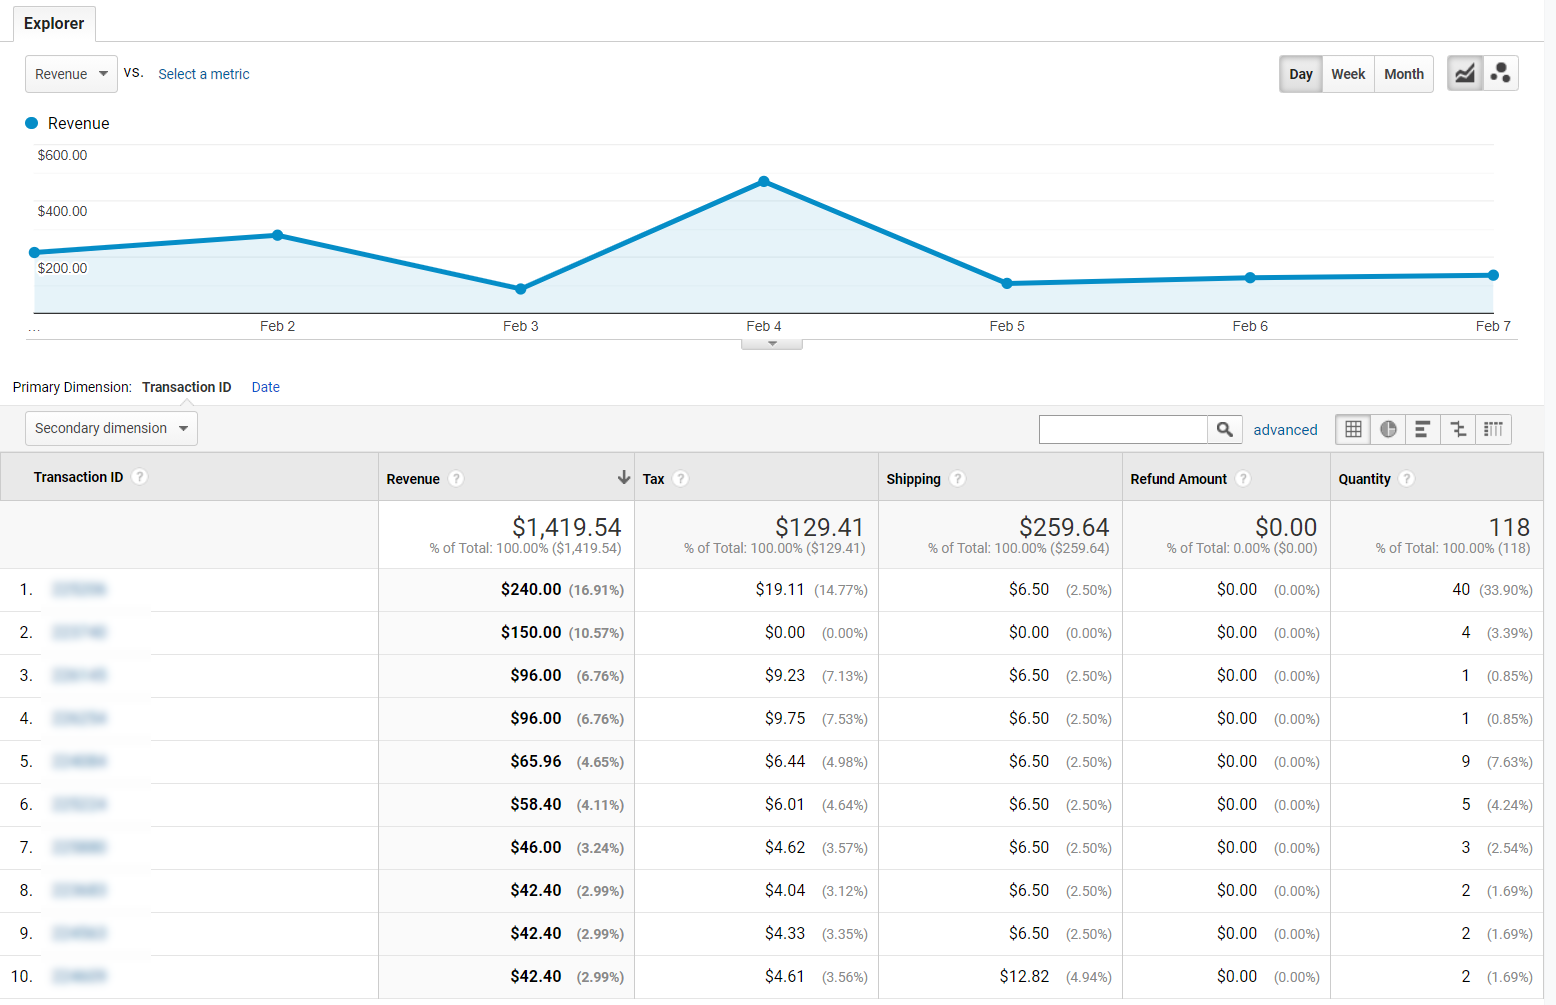
Sales Performance reports allow you to see the revenue for each sale and their related cost regarding taxes, shipping, and refunds. Here we can observe if each transaction by transaction ID, is profitable and correctly set up bringing positive results. Placing a secondary dimension lets you look if the same behavior is happening to different segments of your business.