transformative design & growth for outstanding products & brands
Whether you are a small brand or a big startup, a single entrepreneur or a corporation , we provide a personalized approach to overcome your barriers to growth and product creation. Our Product & Growth Consulting Enrollment service also includes the creation and implementation of advanced tools inside you system, which you will be able to use to drive growth or expand your product.
Whether you are a small brand or a big startup, a single entrepreneur or a corporation , we provide a personalized approach to overcome your barriers to growth and product creation. Our Product & Growth Consulting Enrollment service also includes the creation and implementation of advanced tools inside you system, which you will be able to use to drive growth or expand your product.
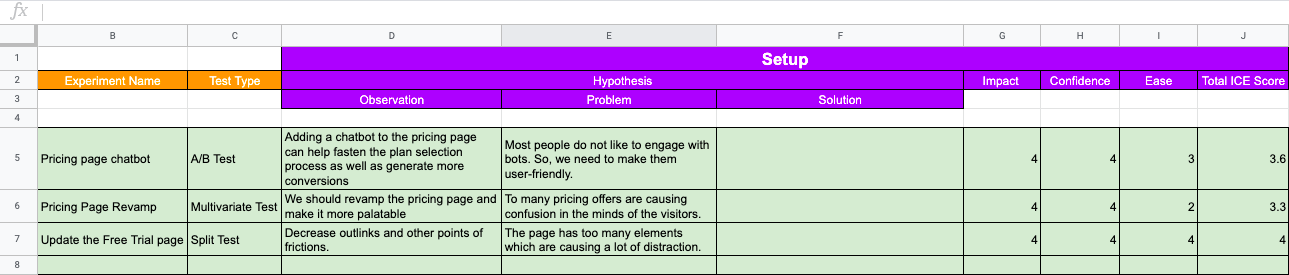
1. Create a spreadsheet and list all your hypotheses in the first column.
2. Consult all relevant stakeholders to collate hypotheses for all upcoming experiments.
Use a tool like VWO, which has an in-built hypothesis repository.
3. Create columns for Impact, Confidence, and Ease in the spreadsheet.
Impact: how much the experiment is likely to positively affect the key metric.
Confidence: the probability that the hypothesis is true.
Ease: the amount of effort, in terms of time utilization, required to run an experiment.
4. Grade each hypothesis on a scale of 1 to 5 for impact, confidence, and ease, with 1 being the lowest and 5 being the highest chance of success.
Consult and discuss with various stakeholders, including experiment creators, product managers, developers, designers, etc. while grading impact, confidence, and ease.
5. Add up the impact, confidence, and ease scores for each of the listed hypotheses and divide the total by 3 to calculate an average prioritization score.
Add the score in the Total ICE score column.
6. Sort your hypotheses on the Total ICE score column or add a color gradient to show priorities.
7. Start testing your hypotheses, prioritizing the ones with the highest Total ICE scores.
8. Develop a repeatable process to revisit past hypotheses and incorporate new hypotheses in the ICE model.