Predict winning A/B tests
Predict winning A/B tests
1. Identify in your website, the number of times a set of UI elements have been used in testing. You can identify them by page type or by page metrics.
You can look in your website data, you A/B testing software, or through your customer research. For example, a page type is the checkout page pattern, and a page metric is the lead-gen pattern.
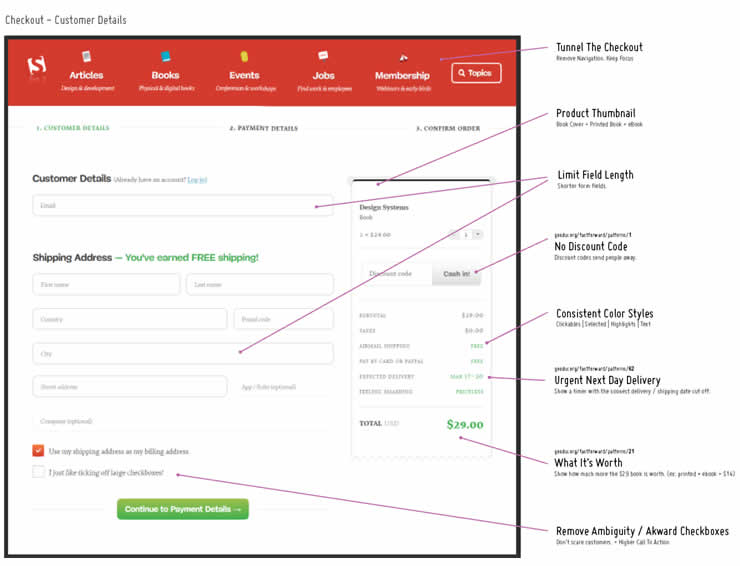
2. Create a screenshot of the pages you have previously tested, and add them in an image editor such as Adobe Illustrator or Photoshop, to take note of possible patterns.
3. Identify micro-conversions elements on each page, and write what adjustments can be made to the page layout or its elements.
Pages like a landing page or check-out pages are optimized for micro-conversions such as text color, button placement, and size of the banner. Draw arrows pointing to one specific element and add annotations that contain changes and ideas
4. Add between 10-100 annotations on all the pages, and prioritize the testing idea with scores from the repeatability score's first number.
5. Scan your website analytics or A/B testing platform, for the number of times a specific element has been tested, and take note of the number of positive results and subtract the number of negative results. Add the Degree of Repeatability under the annotation in Photoshop.
For example, if a pattern had positive results 5 times and negative results 3 times, then the repeatability score is 2.
6. Check your website analytics for the percentile increase in leads, sales, or sign-ups for each pattern, and write the percentage number in the annotation next to the repeatability score.
Median score reliability is more confident when more tests have been conducted with the same pattern.
7. Catalog the data of each pattern in a spreadsheet, taking note of the median score and repeatability score.
The median effect tells us what effect we might expect from a similar change on a future test. Repeatability is a measure of how often a pattern has been tested with winning, or positive results, minus the number of any negative test results.
8. Scan the spreadsheet and see which section of the page performed best. Look at the priority number to identify the pattern that has to be included in the first test.
Add elements based on priority, and create a new page with high prioritized elements
9. Create a page concept using a series of variations that have been previously tested.
Run the tests and update the spreadsheet with the new median and repeatability score. Analyze the spreadsheet again, and create a new variation, while changing only one element that didn’t perform as predicted.