Launch an A/A test in AB Tasty
Launch an A/A test in AB Tasty
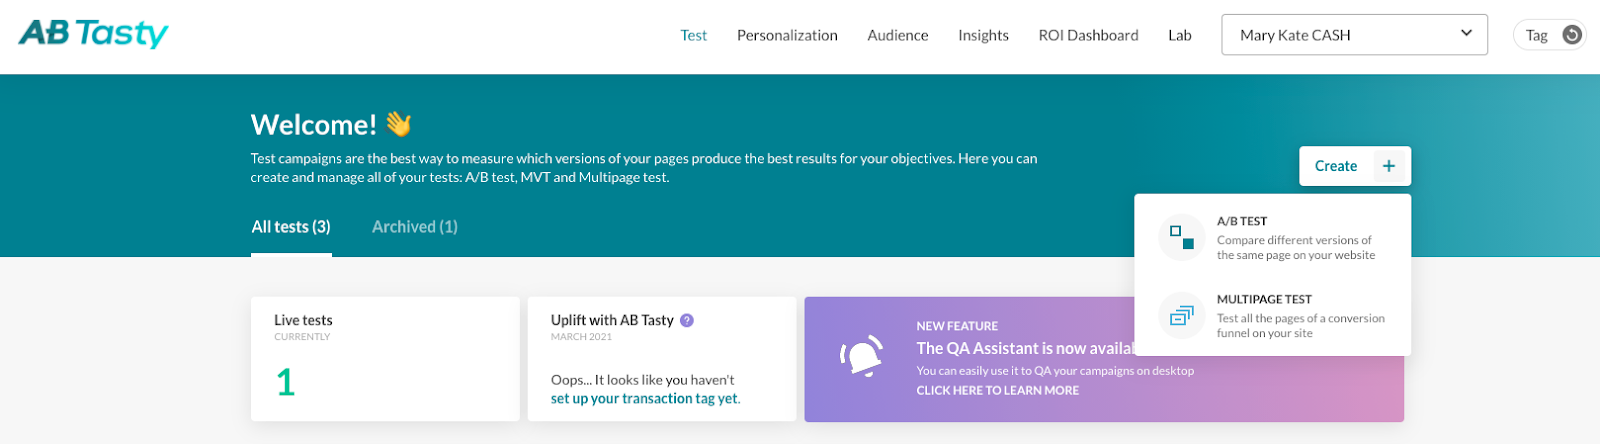
1. Select Test from the top navigation bar. Click Create in the top-right corner and the select the appropriate type of test for your campaign.
2. Name your campaign and set a hypothesis for your experiment based on the following model: If I apply [this change on my webpage] for [this audience], then it will impact [this behavior] and influence [this goal].
Here are some examples of how to influence goals and KPIs through experience optimization: Copy the URL of a page you wish to test and paste it into the “Sample URL to load in the editor” field. Select the type of editor you wish to use: a visual WYSIWYG editor or a code editor. Click “Save & go to next step” in the bottom right corner.
3. Set your targeting in the “Who”, “Where” and “Trigger” sections.
WHO section: this is the most important one, where you have to choose the right segment as a function of the message you have created in the editor. WHERE section: choose the unique URL (or a saved Page) or the type of pages having the same construction (such as Product pages) on which your message will be visible). The URL used in the editor step remains a sample of the URL(s) you configure in this step. TRIGGER section: this step is optional. You can add specific session-based triggers, such as a required number of viewed pages before displaying a message, the landing page of the session, and so on.
4. Click “Save & go to next step” at the bottom of the page.
5. Go to the plugin library within the editor and install plugins/widgets (e.g., scroll percent, time on page, etc.) to gather new data.
For example, install the scroll percent plugin. Simply select “engage” to add the new plugin. Then, configure the plugin to register a conversion each time a visitor scrolls to 25%, 50%, 75% or 100%. Draw data on how many visitors scroll to the end of the page. Similar to how you set the scroll plugin, search for the widget that measures the amount of time visitors spend on time. Click “engage” to install it and set objectives on this widget. For example, set an objective of 30 seconds so the widget shows when visitors spend over 30 seconds on a page.
6. Target specific pages (e.g. landing pages) when you perform the A/A test.
For example, run the test on your home page, product page, order summary page if you have an e-commerce site.
7. Allocate 100% of your traffic to the variant to provide a maximum amount of data for the final report and collect data more quickly.
Alternatively, you can allocate 50% of traffic to your variant, but the data collection will take longer.
8. Link your A/A test with your analytics tool (e.g. Google Analytics).
In addition, link your test with your analytic tool in the Advanced options step to verify that your AB Tasty data collects accurately in your analytics tool.
9. Once you’ve set widgets, traffic and analytics, launch your A/A test or schedule the launch data by clicking on the clock.
Your A/A test is conclusive if the conversion rates for your objective are equal between the original version and the variant if you decided to split your traffic 50/50.