Build data-driven user personas

1. Outline your goals and plan your approach by defining what you need to know, who you will survey, and how you will reach them.

You’ll need to have a certain level of user knowledge to do this. Using simple tools like Excel and Intercom to trace common behaviors can give you a better idea of which types of customers are worth the most money to you.

2. Write a list of survey questions that produce actionable answers based on your business goals.

Keep the survey short enough that people would actually take it. Data collected by SurveyMonkey shows that the longer a survey is, the less time respondents spend answering each question, meaning they’re more likely to rush through it or abandon it altogether.  Use a mix of categorical questions: Multiple choice like, Which best describes your company? Scale questions like, When purchasing , how important are the following factors on a scale of 1-5? Open-ended questions like, What’s the most challenging skill used in your job?

3. Use a tool like Typeform or SurveyMonkey to create and send the survey to your customers or audience.

Who you send the survey to depends on your company stage and industry. For example, a startup may have few users, let alone engaged users, and therefore needs to find non-users who are representative of their target customer. A public SaaS company may have dozens of different personas and may need to segment them by what they’re trying to learn in this research project. This is a question a UX researcher needs to determine with the key business stakeholder for the product. When in doubt, try to get at least 300 responses from engaged product users or nonusers who are representative of that target persona.

4. Collect, compile, and organize your data once you get about 300 responses.

300-1,000 survey responses make for good data, but there’s no magic number. Factors like the survey quality, audience targeting, and your own data analysis skills all matter more than pure sample size.  
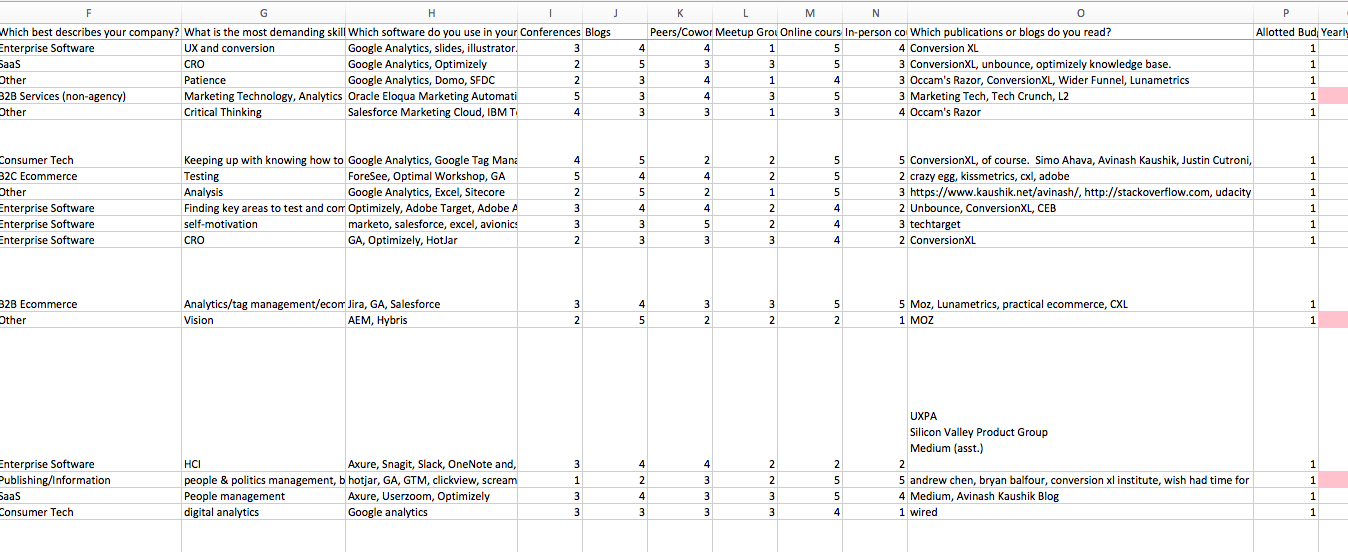
Organize your data into rows and columns in Excel, R, or your preferred statistical tool. Add survey variables as columns and responses or observations as rows, and get rid of any blank cells (N/A values). Your data should look something like this: Example of what compiled response data should look like in Excel.

5. Conduct exploratory factor analysis to identify the underlying relationships between variables.

Look out for factors that predict how people answer certain questions. There are many ways to carry out exploratory factor analysis in R, but the most commonly used method is the out-the-box factional() function. Another popular way is to use the psych package. Consider using principal component analysis, which is similar to and often confused with factor analysis, if exploratory factor analysis doesn’t reveal much.

6. Use clustering to group data and separate respondents into personas based on their answers.

Make sure you scale and center your data if you have certain variables that are much larger than others. For example, scale and center your data if you have both answers on a scale of one to five and answers that go into the thousands. 
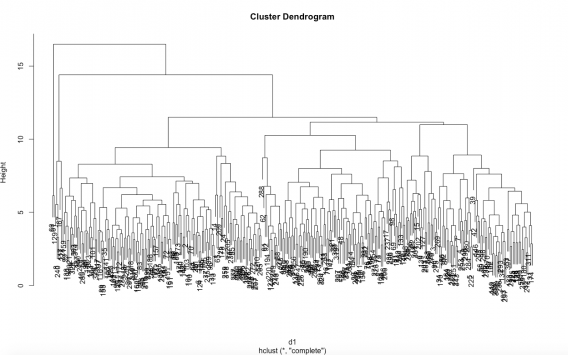
Here’s an example of how scaled and centered data can be created in R and organized into hierarchical clustering to produce a dendrogram, which is a tree diagram used to illustrate the arrangement of the clusters produced by hierarchical clustering:         scaledpersonas <- scale(personas123, scale = TRUE, center = TRUE) d <-dist(scaledpersonas) c <- hclust(d) plot(c) Dendrogram illustrating the arrangement of the clusters produced by hierarchical clustering. Alternatively, you can use k-means clustering to pick the number of clusters you’d like before you do the analysis. Here’s an example showing clusters for three personas with lots of overlap caused by common responses: K-means clustering example showing data overlap for three clusters due to common responses.

7. Use pivot tables in Excel to interactively explore persona data from different angles.

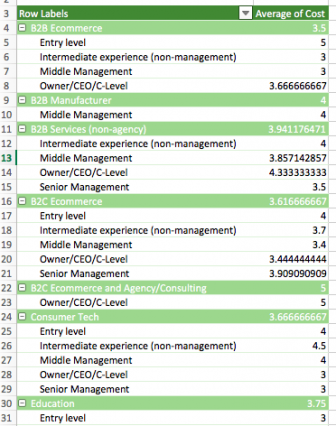
Pivot tables allow you to place different variables in different columns/rows and analyze factors like averages, standard deviations, and sums. There’s no fixed order process for analyzing data using pivot tables. Spend time exploring the data, looking for surprises and things you didn’t expect. For example, you can then set up different worksheets with the respondents that fell into each cluster from your cluster analysis to see how they answered the various survey questions. This allows you to compare the means of different variables to find key differences and common data. You can also create pivot tables that contain more than one-row variable. Here’s an example of one that shows the average rating of how important cost is by type of company and seniority of employee: Example of a pivot table showing the average rating of how important cost is by type of company and seniority of employee

8. Clean up the qualitative data from open-ended responses and use it to determine qualitative differences between your personas.

Codify responses to help quantify information. For example, responses like Adobe Analytics and Google Analytics can both go under an Analytics category. Word clouds built using qualitative variables or categories can help you get a high-level view of what your audience is saying. At this point, you should be able to fully segment your audience based on the information you asked for in your survey and the responses you received.

9. Conduct 2-5 one-on-one interviews for each persona to find emotional triggers that can help you with messaging strategy, emotional targeting, and design.

Take a journalist’s attitude and go into the conversation with a sense of curiosity and exploration. The point is to make it feel unlike an interview and more like a conversation with a close friend. Aim for detailed answers rather than surface-level answers you can look up in product analytics.   Ask deliberate, open-ended questions designed to spur emotion and depth. Some examples include: What’s your role at your company? Explain at a high level and day to day. What is your career background? What’s the single biggest challenge at your job? What are you motivated by? What keeps you up at night? Whose advice do you trust? Who do you follow or ask when you have a challenge?

10. Use a tool like the Buyer Persona Toolkit to organize your data and design and communicate your buyer personas.