Build automated dashboards using your BigQuery data

1. Connect your Google BigQuery to your preferred tool, to start building your dashboard.

BigQuery connects to non-Google visualization platforms like Qlik, Tableau, and Power BI. For Tableau use the Get Data section, and search for Google BigQuery to connect to your BigQuery data. In these examples we will use Google Data Studio. Head to Google Data Studio and click on Blank Report. In the Add data to report section, search for BigQuery Connector.

2. Use BigQuery connector to connect to your table, view, or write a custom query.

After clicking on BigQuery connector, you will be able to choose from your own projects, the projects shared with you, public datasets, or write a custom query. Write a custom query if you know precisely what type of data, from what table, you need to work with now:

3. Connect Data Studio to a table.

Choose Public Datasets > google_political_ads dataset (use your own table if you want) > advertiser_stats under Table and click Add > Add to Report. Data Studio will automatically build your first table: Change the chart type in the right corner to Pie Chart. Change your dimension to regions, and metric to spend_inr You get your pie chart with spend per region. Click on Add data in the top of your Data Studio window. 
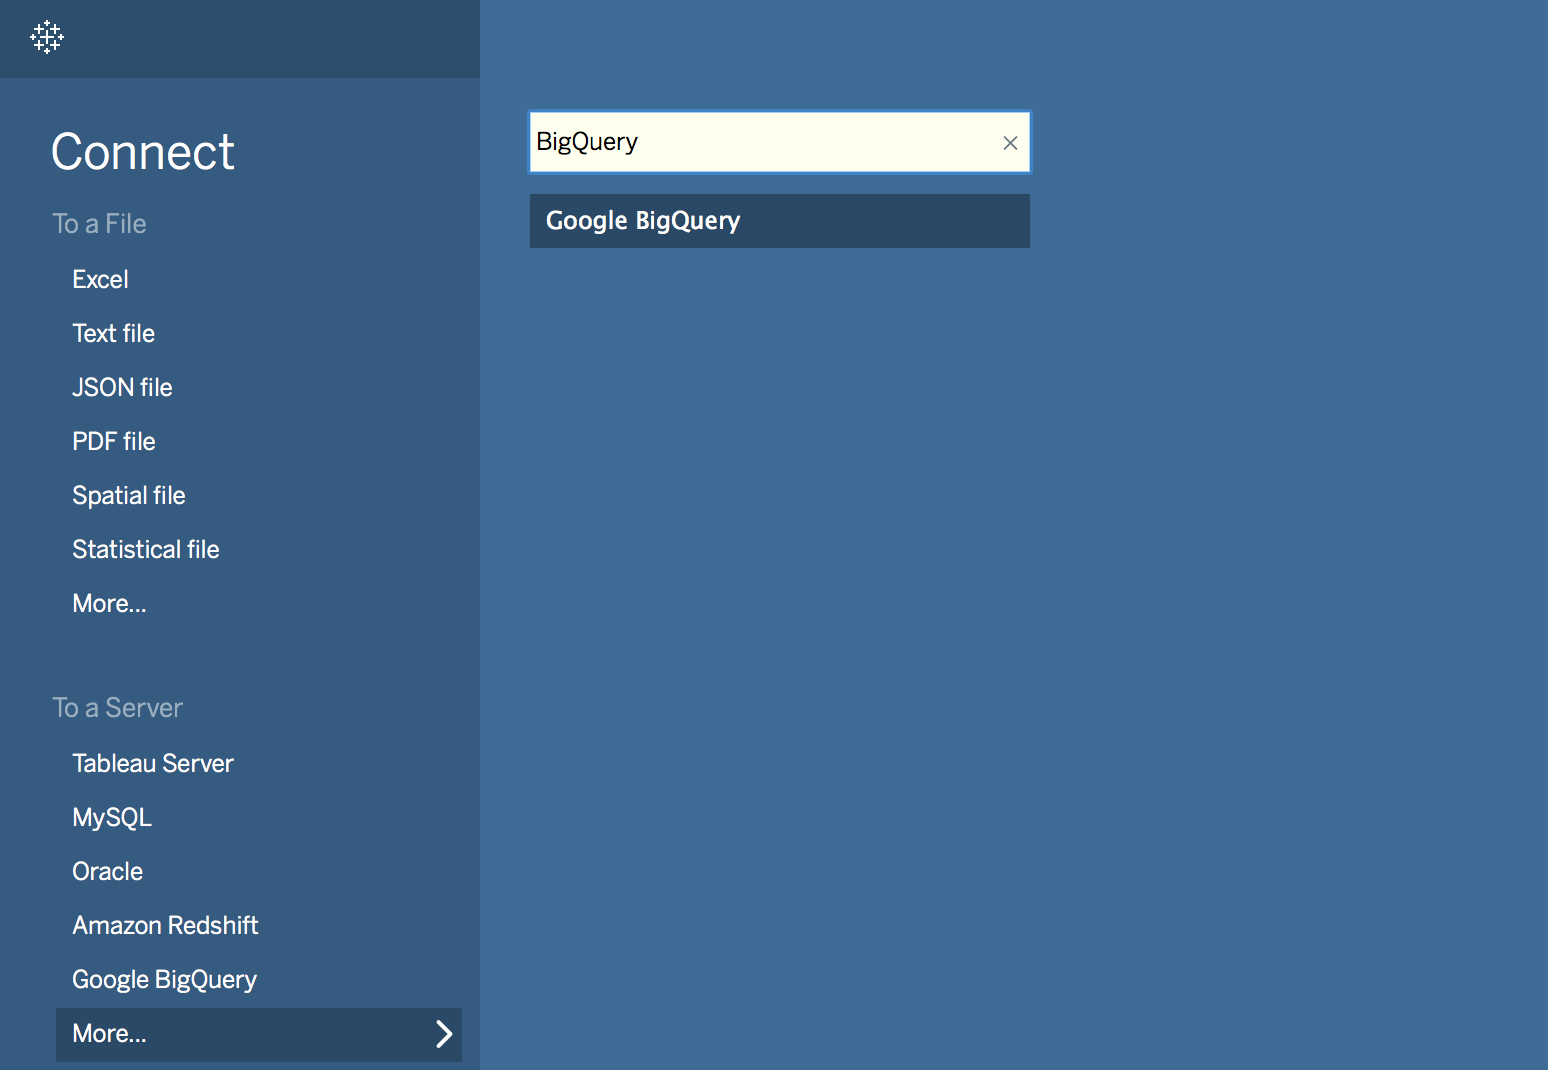
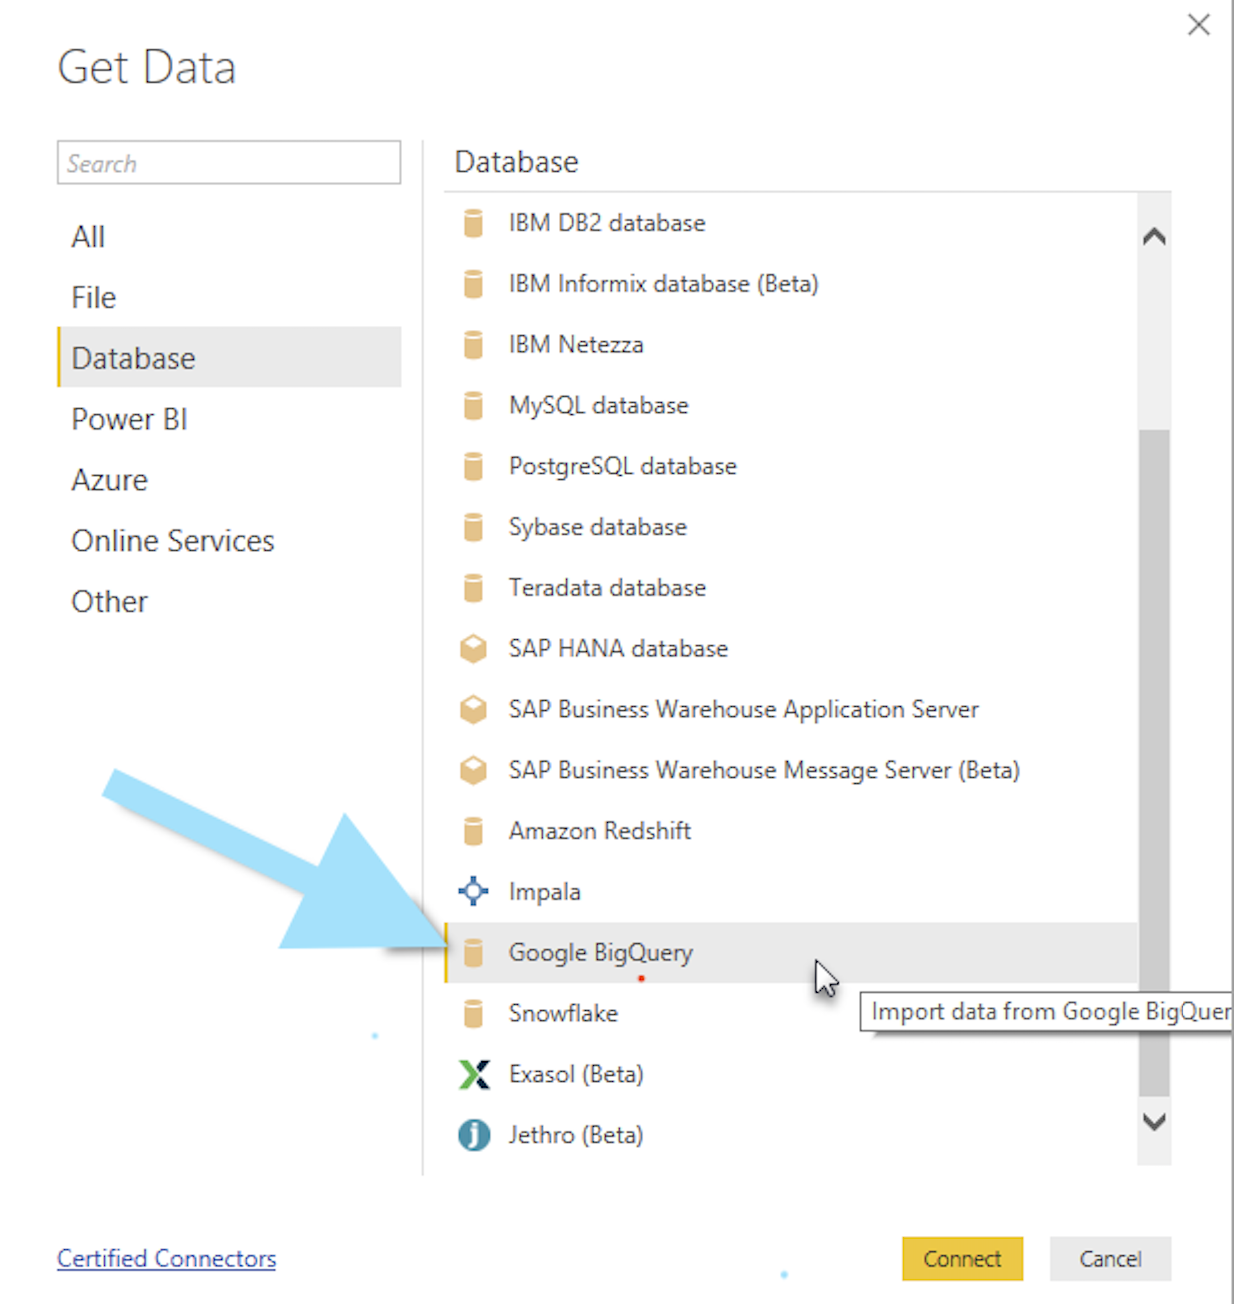
Choose BigQuery connector and connect to another table in the same public dataset – advertiser_weekly_spend: When your new data is added, click on Add a chart and choose Time series chart: In the data sources you’ll see that you now have two tables available. Choose advertiser_weekly_spend: You’ll see this graphic appear: Click on Add a control at the top, then Data range control. Place this widget above your Time series table. Click on View mode to see how you can interact with your dashboard. Choose September 2020 to check how graphics changes. Add a rectangle, from the top panel, to design your dashboard. Choose a colour you want Place this rectangle on your graphics area, and place it backwards so it will appear as a background:

4. Connect Data Studio to a view or scheduled query.

Use a view if you don’t want to create and store a table, but you’ll need to address a particular query result quite frequently. Some recommend using scheduled query instead, this regularly refreshes data from a table. You can try both and analyze your data consumption. Running a view can be more expensive than addressing a table alimented by a scheduled query. Run this query in your BigQuery: SELECT CASE WHEN regions LIKE "%EU%" THEN "Europe" WHEN regions = "US" THEN "United States" ELSE "Other" END as regions, sum(total_creatives) as creatives FROM `bigquery-public-data.google_political_ads.advertiser_stats` GROUP BY regions ORDER BY creatives DESC Save the result as a View: In your Data Studio, click on Add data in the top panel, choose BigQuery > your project > your dataset > your view > creative_per_region. The process is the same as adding a normal table to your Data Studio. Click on Chart > Table and choose creative_per_region as data source.

5. Build your dashboard using different types of connection to BigQuery.

When using Data Studio and its BigQuery connector, you can connect to: Your tables, ordinary or alimented by your scheduled queries. Your views. Your custom queries. Public dataset tables.