Benchmark UX with CUX model

1. Choose a task for users to perform.

For example, if you sold nutritional supplements, you could have users open up your or a competitor’s site, find whey protein powder in a 2-4lb package, and add it to their shopping cart.

2. Choose the websites to be benchmarked.

You can choose to benchmark your website against 4 competitors or against a pre-selected sample of 4-5 top ecommerce sites in your market. Your website will also be benchmarked against a select sample of 100+ ecommerce websites from Amazon’s Alexa’s Top 500 Sites on the Web, so you’ll find out how your website compares within your market, as well as how your market compares to the industry as a whole.

3. Wait to receive your CUX benchmarking report.

A survey will be launched once your task and websites to be benchmarked are confirmed, and the users perform the task. Once the survey is completed by a minimum of 100 people, the results will be compared against a database of scored sites and your chosen competitors, if any.

4. Use the CUX benchmarking report to find out where you rank compared to your benchmarked competitors and other websites, ranked across all industries.

Your CUX Benchmarking report will provide the survey results ranking your website against CXL’s full database of websites. It also shows your website’s competitive rank on a normalized curve of all websites ranked across all industries. Sites are evenly distributed along the x-axis in balance and each site is plotted relative to the others based on the standard deviation of the all sites in the sample.  For example, the image below illustrates the report for Swanson Vitamins: Your CUX Benchmarking report shows the survey results ranking your website against CXL’s full database of websites and your website’s competitive rank plotted on a normalized curve of all websites ranked across all industries.

5. Use the report to find out in which metrics you are better or worse than your competitors.

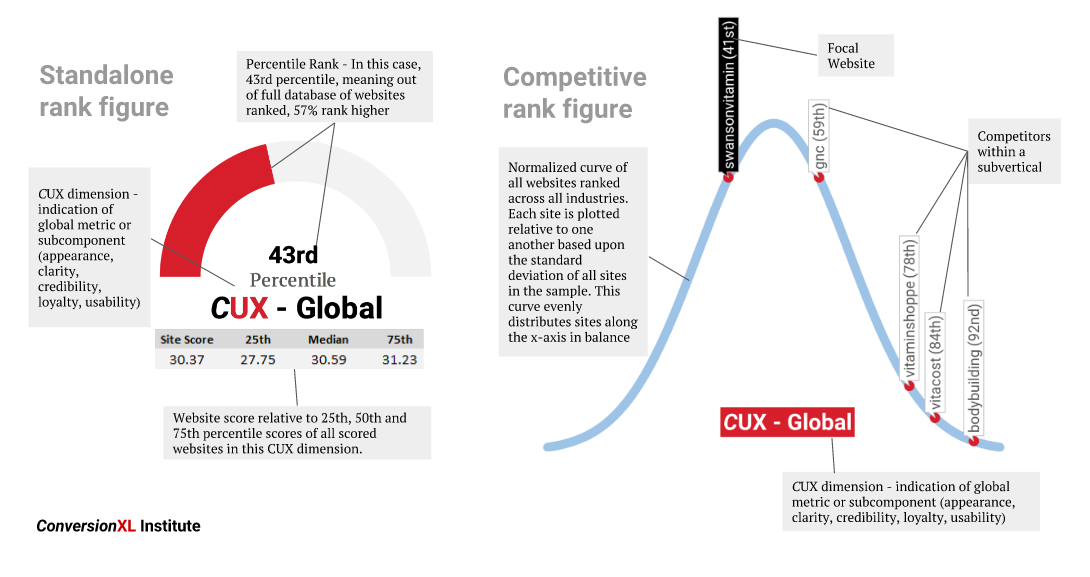
The CUX Benchmarking report offers a high-level overview, shown as a percentile ranking, of where you rank globally, as well as in each CUX metric, including clarity, usability, credibility, appearance, and loyalty, in comparison to the entire benchmark database of scored sites.  
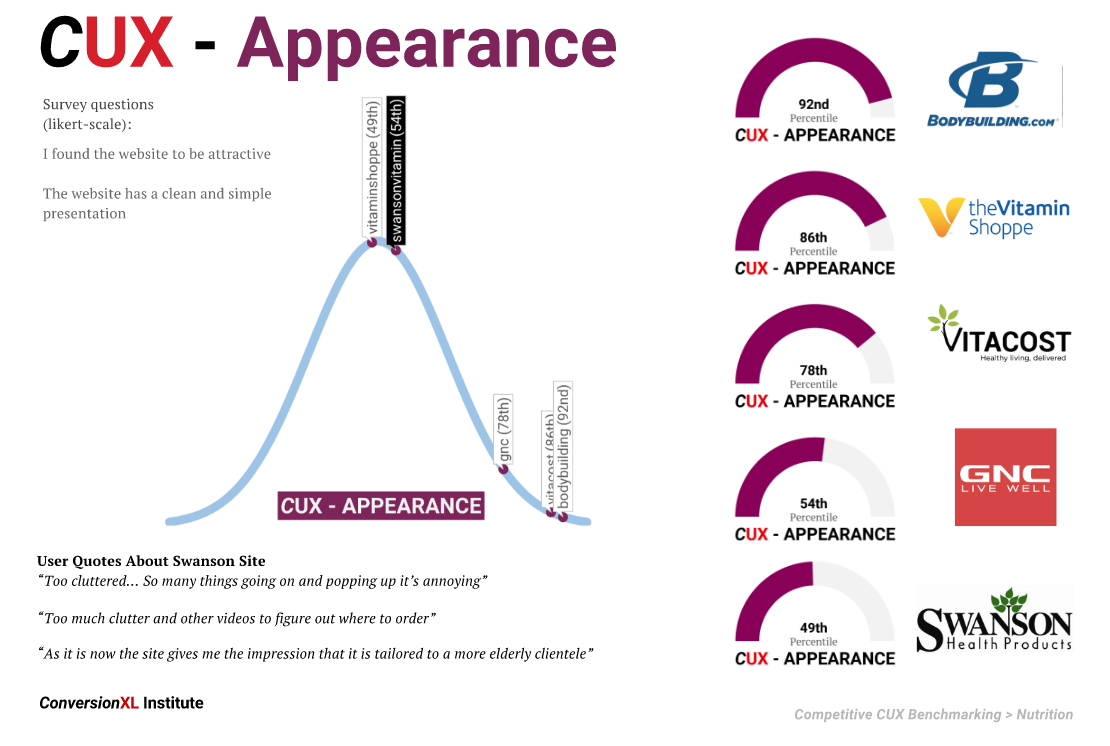
You can then view each metric individually to find out how your website stacks up against the benchmark competitors, as well as the relevant survey questions that created the score and user quotes related to the UX metric. Here’s an example of what the CUX benchmarking report showed for Swanson Vitamins for the Appearance metric: Viewing each metric shows how your website stacks up against the benchmark competitors, relevant survey questions that created the score, and user quotes related to the UX metric.

6. Prioritize A/B test ideas for changes in areas you may need the biggest improvements.

The CUX benchmarking report and user quotes offer valuable insight into the areas you need to focus on and how you can improve them, and therefore you should prioritize test ideas if they might affect the areas that need improvement. For example, if your website’s UX is behind your competition in appearance, you could prioritize tests like replacing stock manufacturer photos with professional contextual images.

7. Derive ideas from the qualitative user feedback to further inform prioritization and continuously optimize.

Because you get to watch people interact with your site, hear their qualitative feedback, and see where you rank compared to your competitors, it’s easier to see patterns in terms of specific elements. These insights can be treated like a springboard from which you can continuously optimize your site.